Difference between revisions of "Team:BJRS China/Model"
| Line 149: | Line 149: | ||
<tr> | <tr> | ||
<td>r<sub>c</sub> </td> | <td>r<sub>c</sub> </td> | ||
| − | <td>Corrected <i>r</i> | + | <td>Corrected <i>r</i> removing the effect of original oxygen concentration</td> |
</tr> | </tr> | ||
<tr> | <tr> | ||
| Line 173: | Line 173: | ||
<tr> | <tr> | ||
<td>O<sub>2ori</sub></td> | <td>O<sub>2ori</sub></td> | ||
| − | <td> | + | <td>the original oxygen concentration surrounding the bacteria</td> |
</tr> | </tr> | ||
<tr> | <tr> | ||
Revision as of 22:53, 17 October 2018
Modeling
Hypothesis
Hypothesis 1:VHb has linear influence on available oxygen
Hypothesis 2:the gaining effect of available oxygen is orthogonal to the burden of producing VHb
Formulas
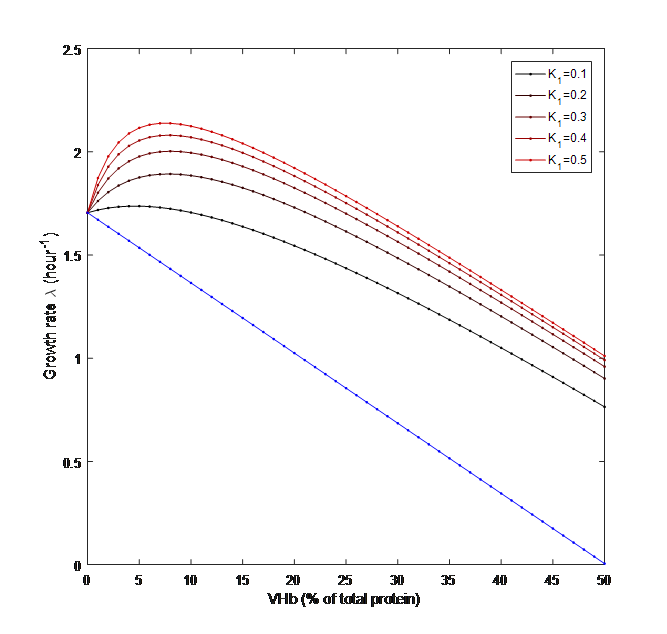
We assumed that VHb has an additional positive effect on the surrounding oxygen concentration. The adsorption coefficient of VHb which shows the relationship between incremental oxygen concentration and VHb protein concentration in the bacteria is designated as K1, whose value is determined by the efficiency of VHb; And the conversion coefficient which convert the percentage of VHb into concentration of VHb is designated as K2. Therefore, K1K2pVHb will denote the incremental oxygen concentration surrounding the bacteria. The total oxygen available will be the original oxygen concentration plus the incremental oxygen adsorbed by VHb as shown in Formula 1.

Previous researches have reported that the growth rate of bacteria is affected by both the oxygen concentration and protein expression. Stolper et al. (2010) showed the positive relationship between oxygen concentration and growth rate; Scott et al. (2010) reported the negative effect of gene expression on growth rate since protein expression is an energy-consuming process. Given an unchanged level of total energy, additional protein expression will reduce the energy available for cell growth. Based on these two researches we got the relationship between growth rate and VHb concentration as shown in Formula 2.

Since the original growth rate r was measured under the original oxygen concentration, we made a correction using Formula 3 to remove the influence of the oxygen concentration, and the corrected rc was applied to Formula 2.

| symbol | description |
| r | R[2] |
| rc | Corrected r removing the effect of original oxygen concentration |
| k | the slope from R[2] |
| Ks | The amount of oxygen at half effect |
| pVHb | the percentage of VHb in total bacterial protein |
| μ | growth rate of the bacteria |
| μmax | The maximum growth rate of the bacterial under the adjustion of oxygen concentration |
| O2ori | the original oxygen concentration surrounding the bacteria |
| O2useful | The total amount of oxygen available to the bacteria |
| K2 | The conversion coefficient of VHb concentration for the total amount of protein |
| K1 | The adsorption coefficient of VHb on oxygen |
Explaination of parameter
| Value | Reference | |
| Ks | 121nM | R[2] |
| μmax | 2h-1 | Supposed from R[2] |
| r | 1.7h-1 | R[1] |
| K | 0.034 | R[1] |
| K1 | 0.5 | hypothesis |
| K2 | 100 | hypothesis |
| O2ori | 100 | hypothesis |
Result
References
[1] Stolper D A, Revsbech N P, Canfield D E. Aerobic growth at nanomolar oxygen concentrations. [J]. Proceedings of the National Academy of Sciences of the United States of America, 2010, 107(44):18755-18760.
[2] Scott M, Gunderson C W, Mateescu E M, et al. Interdependence of cell growth and gene expression: origins and consequences. [J]. Science, 2010, 330(6007):1099-1102.