Team:Nanjing-China/Results


Overview
This year we aim to achieve light-driven nitrogen fixation based on nitrogenase and OmpA-PbrR. So we divided our experiments into 2 sections: Verification and characterization of CdS semiconductor and Authentication of nitrogenase in E. coli cells.
To demonstrate that our design, we set the E. coli JM109 strain containing both nif gene cluster and OmpA-PbrR gene (abbreviated as EJNC in the following passage) as the experimental group. while E. coli JM109 (abbreviated as EJ) that doesn’t contain any of those genes was set as a control group.
Verification and characterization of CdS semiconductor

Figure 1. Cd2+ toxicity test. Cadmium ions shows no significant toxic effects on both strains.
In order to determine the optimum Cd2+ concentration of the system, we conducted a Cd2+ toxicity test. The existence of cadmium ions shows no significant toxic effects on both strains which is evidenced by the virtually equal colony forming units, though a short term growth readjustment brought by heterologous gene expression does occur in EJNC. Considering that, we select 150 μM as the Cd2+ concentration for our follow-up experiments.

Figure 2. Cd2+ absorption test. The introduction of OmpA-PbrR confers the host cell with Cd2+ absorption capacity.
The amount of biosynthesized CdS semiconductor on the E. coli cell surface was measured using inductively coupled plasma mass spectrometry (ICP-MS). It confirms the surface-displayed PbrR-mediated biological precipitation of CdS semiconductor on the outer membranes of cells.
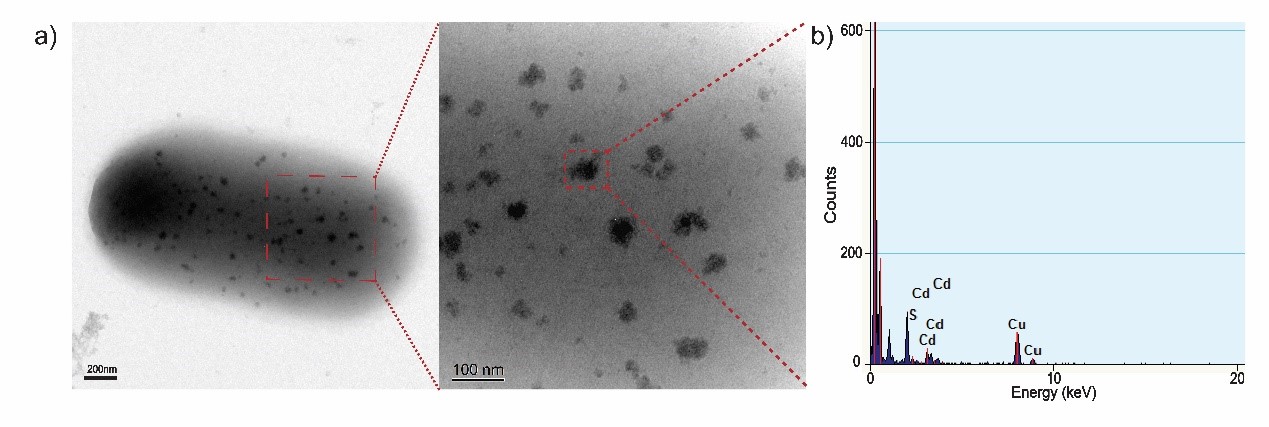
Figure 3. (a) TEM images of biosynthesized CdS nanoparticles on the surface of a EJNC cell.(b) EDX confirmation of randomly chosen CdS nanoparticle. The absorbed Cd2+ precipitates on the outer membrane of EJNC in the form of CdS nanoparticles.
To acquire a fuller understanding of CdS nanoparticles’ characteristics, we performed transmission electron microscopy (TEM) analysis of CdS nanoparticles. The morphology and particle size of CdS nanoparticles are shown in TEM images. Next, we conducted energy-dispersive x-ray spectroscopy (EDX) to analyze its elemental composition. The result demonstrates that the semiconductor on cell surface is mainly composed of cadmium and sulfide.

Figure 4. Characterization of biologically precipitated CdS nanoparticles on the outer membranes of E. coli cells. The UV-Vis Spectrum of E. coli/CdS hybrids in solution demonstrating a band gap at 424 nm.
We performed ultraviolet-visible (UV-vis) spectral measurements to directly determine the optical band gap and photocatalytic capability of these CdS semiconductor. The lowest-energy transition of the biosynthesized CdS nanoparticles was detected in the visible region of the solar spectrum (Eg = 2.92 eV, λabsorption = 424 nm), verifying its photocatalytic ability.

Figure 5. Quantitative comparison of the photoelectrical capacity of in situ biosynthesized CdS nanoparticles. The concentrations of reduced methylviologen (MV) in various experimental groups confirm that the CdS nanoparticles precipitate on the EJNC cells adsorb a photon and transfer an electron to MV2+.
The redox dye methylviologen (MV2+) is a well-established electron mediator. In combination with MV2+, the E. coli/CdS hybrids system easily serve as a biocatalyst for photosynthesis. The concentrations of reduced MV in various experimental groups were measured under anaerobic conditions, confirming that CdS semiconductor transfers an electron to MV2+ for every photon it absorbs.
Authentication of nitrogenase system in E. coli cells

Figure 6. Expression profiles of each structure gene in the nif cluster that overexpressed in EJNC. Relative expression compared to the housekeeping gene 16S rRNA is shown. qRT-PCR analysis demonstrates that all the component genes of the nif cluster are significantly over expressed in EJNC whereas the transcription of these genes are no detected (N.D.) in nondiazotrophic E. coli JM109.
To verify the expression of nif gene cluster, we conducted Real-time Quantitative PCR(qRT-PCR) to detect the transcriptional level of each nif gene in engineered E. coli, using 16S DNA as an internal reference. The result provide the relative expression level of each nif gene in our constructed E. coli strain. After comparing the result with the nif gene cluster expression in Paenibacillus polymyxa CR1, we modeled the transcription and planned to optimize the structure of nif gene cluster to achieve the best stoichiometric proportion of each nif gene. (see modeling for more details)


Figure 7-13. Acetylene reduction assay.
Nitrogenase can not only reduce dinitrogen to ammonia, but also reduce acetylene to ethylene. Therefore, we performed acetylene reduction assay to indirectly detected its nitrogen fixation activity. First, we plugged in 2ml of engineered bacteria (OD600≈0.3) in a 20ml thermo gas injection bottle, and injected Ar gas into the bottle to remove the air as much as possible. Since the removal of air is definitely not complete, it was necessary to cultivate for 6h to exhaust the oxygen through bacterial respiration. We then took 2ml of acetylene and injected it into a gas collecting bottle after oxygen removal in culture. The culture then reacted in our device for 16h. After that, we took 1ml of the gas from the post-reaction gas collection bottle. In order not to exceed the gas chromatography’ s range, 1ml sample gas was injected into a gas-collecting bag filled with nitrogen to dilute the sample gas. Finally, we used gas chromatography to measure ethylene content in sample. Our sample has been sent for testing by the time Wiki freeze, and we anticipate to receive the result within 5 days. We hope to share our results at the Giant Jamboree.
Address
Life Science Department
#163 Xianlin Blvd, Qixia District
Nanjing University
Nanjing, Jiangsu Province
P.R. of China
Zip: 210046


