We were amazed by the possibilities of the iGEM InterLab study project. This project is the biggest interlaboratory study ever done in synthetic biology. We know this is going to push the frontiers of science towards achieving true experimental reproducibility and systematic consistency.
Since these elements are also key-aspects of a manufacturing project such as Phactory, we took this opportunity to participate very serious.
Materials and Methods
| Plate Reader: | FLUOstar (BMG LABTECH) |
|---|---|
| Plate Reader Plates: | 4titude Vision Plate 96 Well (black plate with clear flat bottom, rounded wells) |
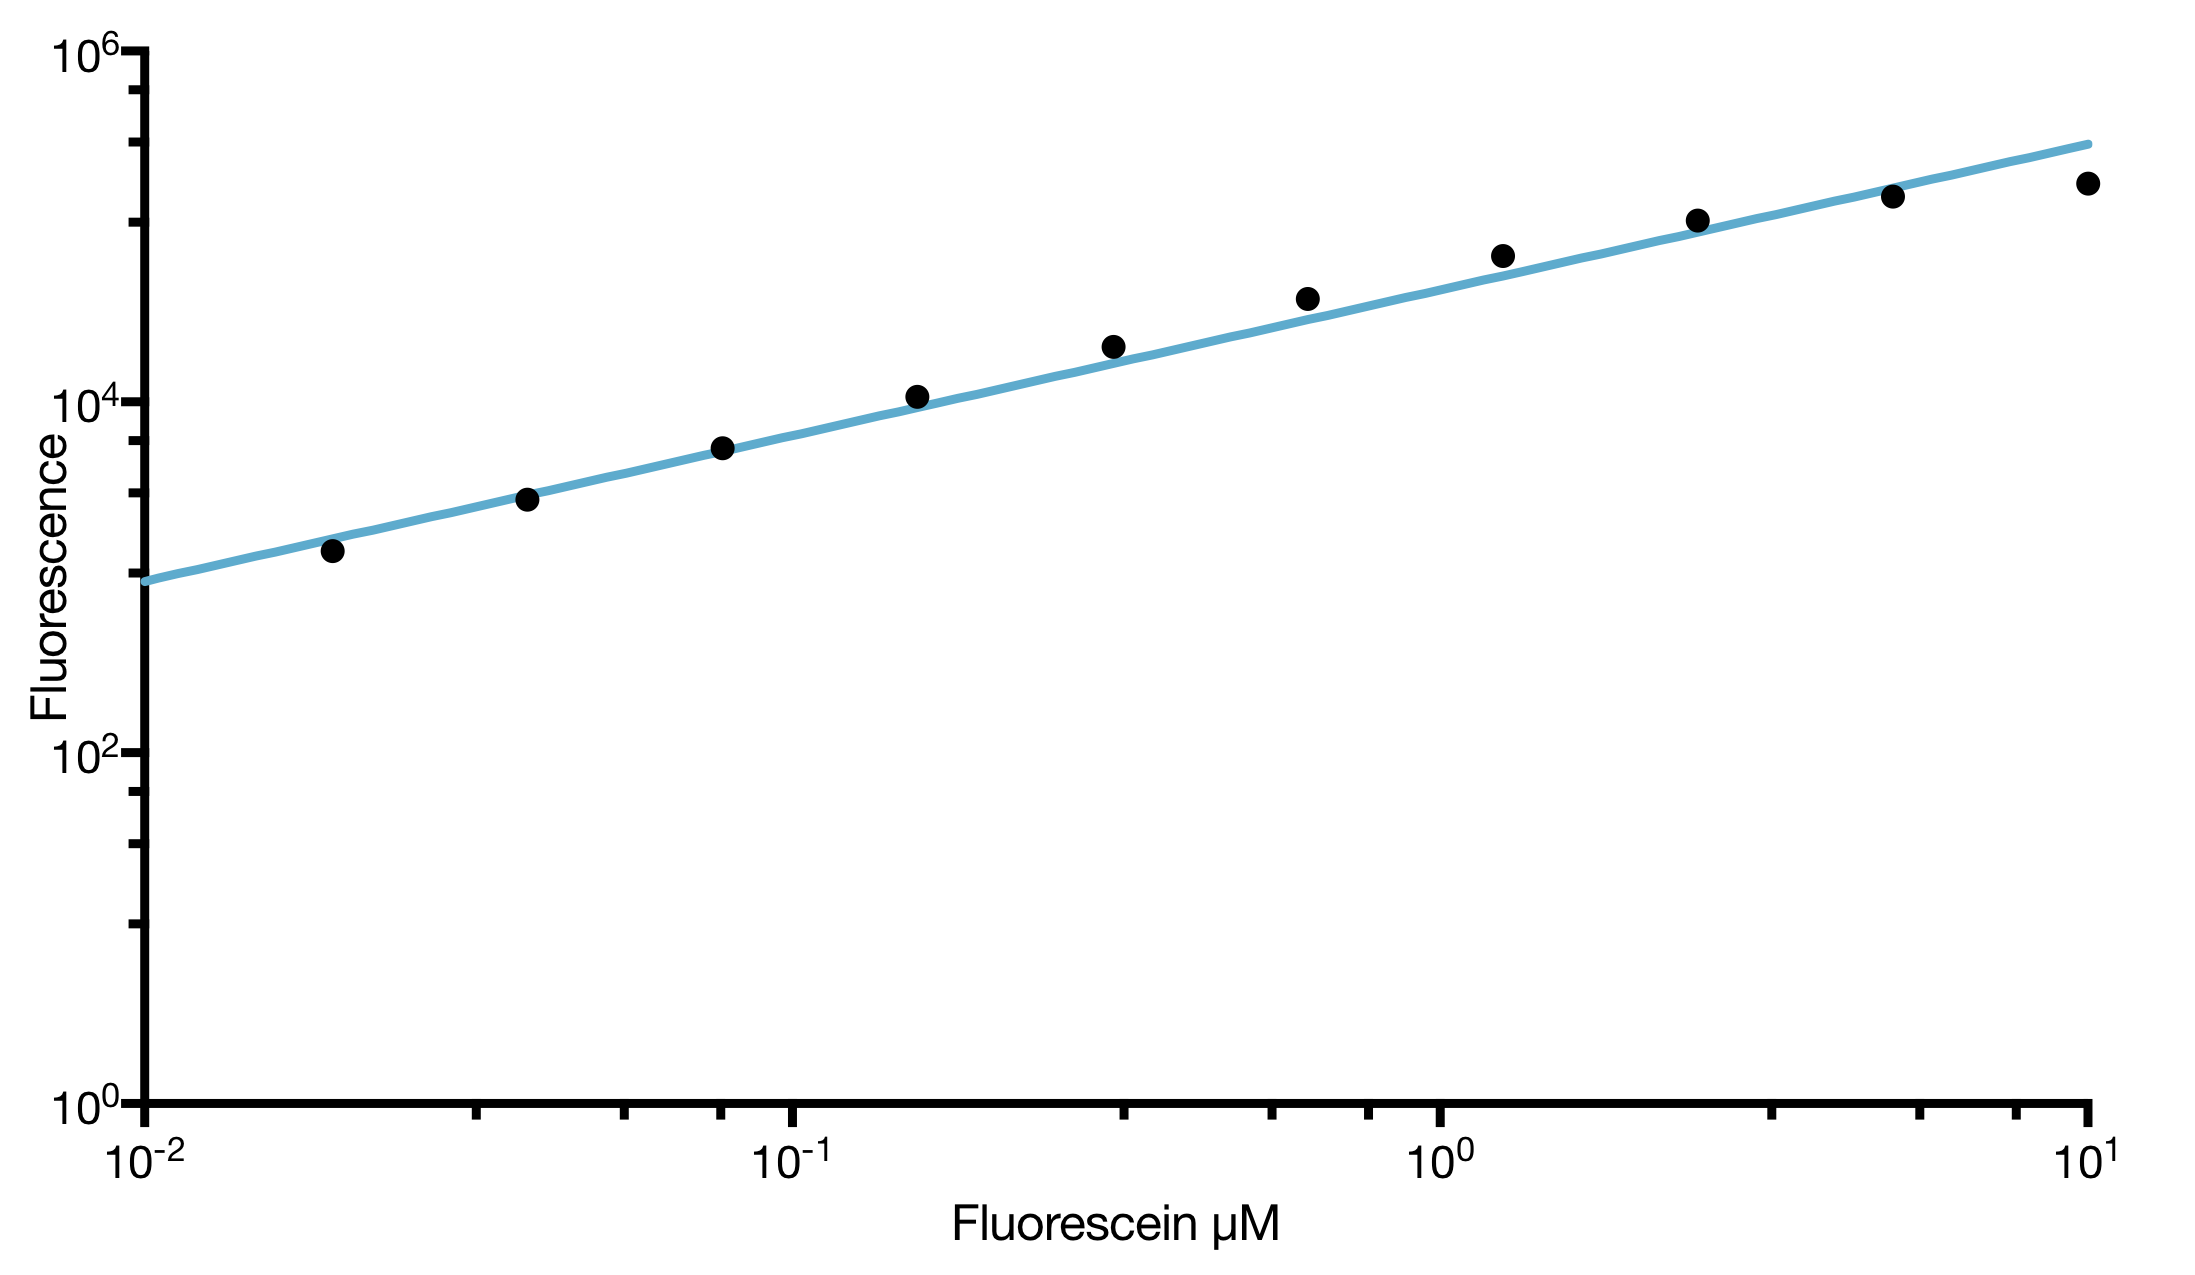
| Calibration Material: | LUDOX for absorbance and Fluorescein for fluorescence (provided in the IGEM distribution kit) |
| Flow Cytometer: | Cube 8 Sysmex Partec |
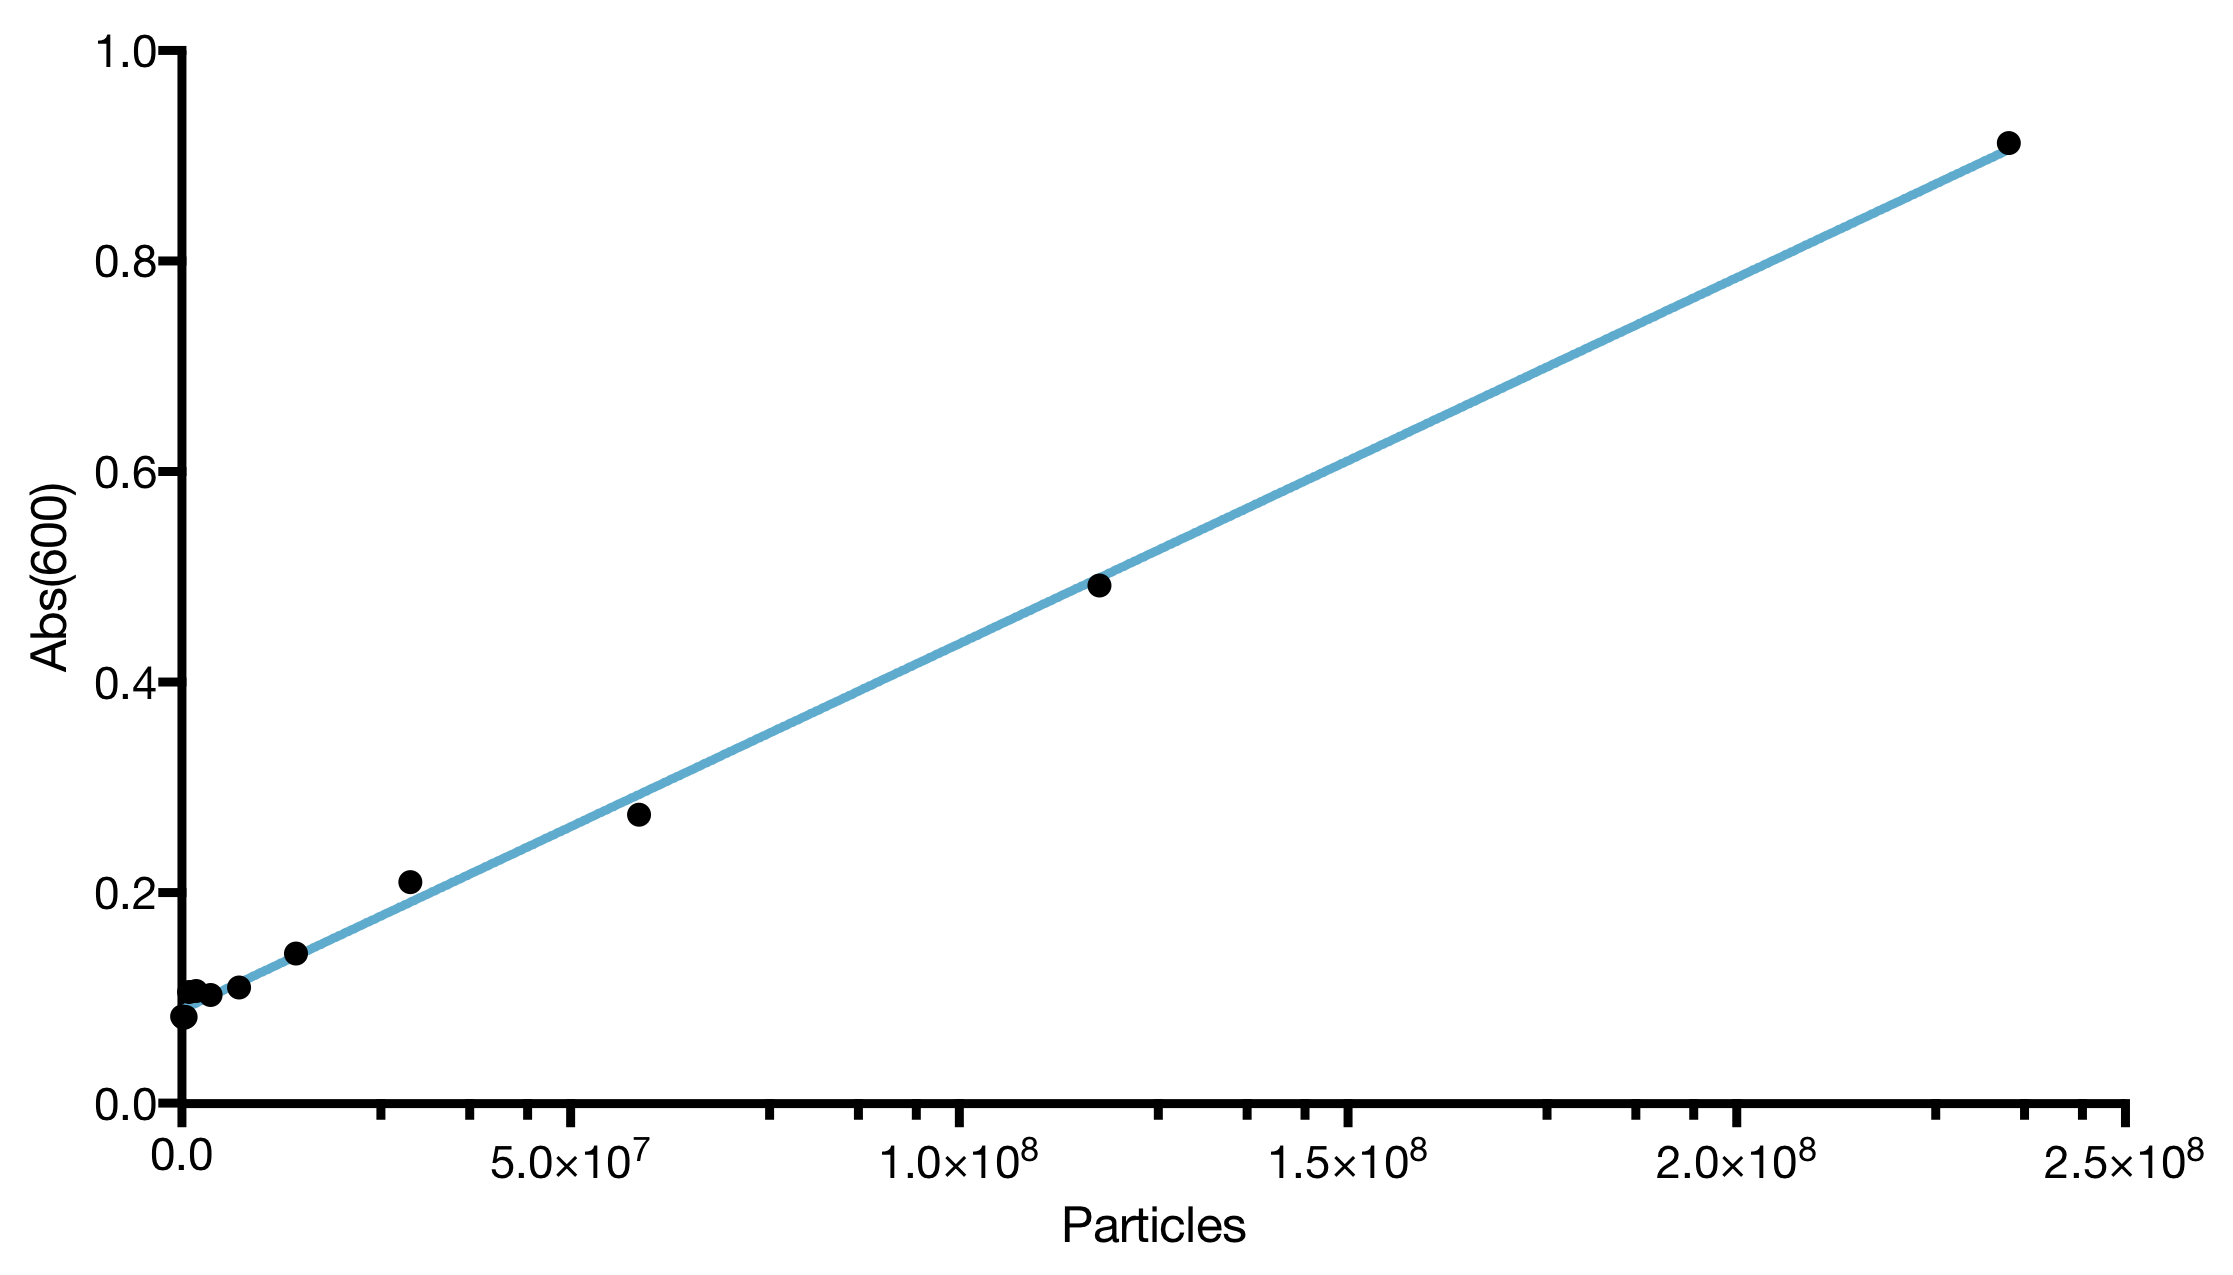
| Calibration Particles: | SpheroTech Rainbow calibration particles type RCP-30-5A |
| Microorganism: | Escherichia coli DH5⍺ strains |
We followed the plate reader protocol and the the flow cytometry protocol provided by iGEM HQ.
Plate Reader Configurations
| Gain: | 600 |
|---|---|
| Number of flashes per well (absorbance): | 20 |
| Number of flashes per well (fluorescence): | 20 |
| Temperature: | 28,9 °C |
| Excitation wavelength: | 485 nm |
| Emission wavelength: | 520 nm |
| Shaking: | 500 rpm |
| Path length correction: | off |
Results and Discussion
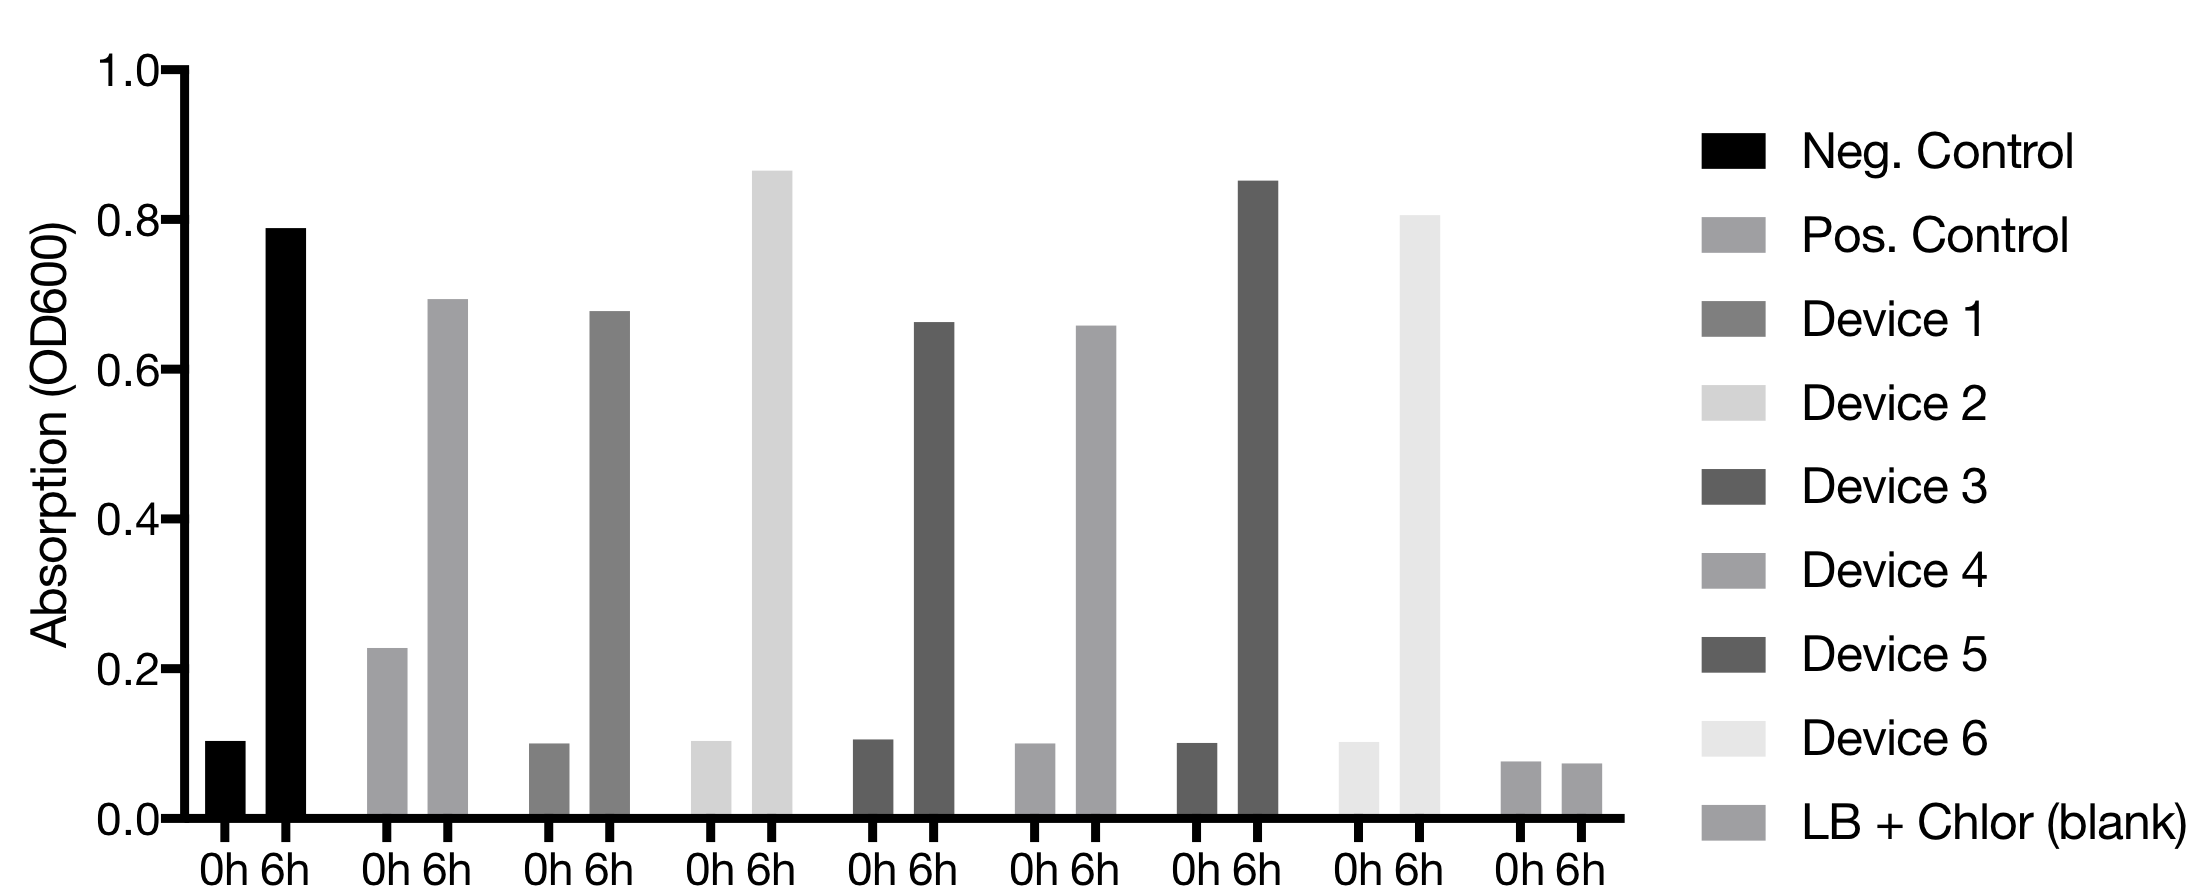
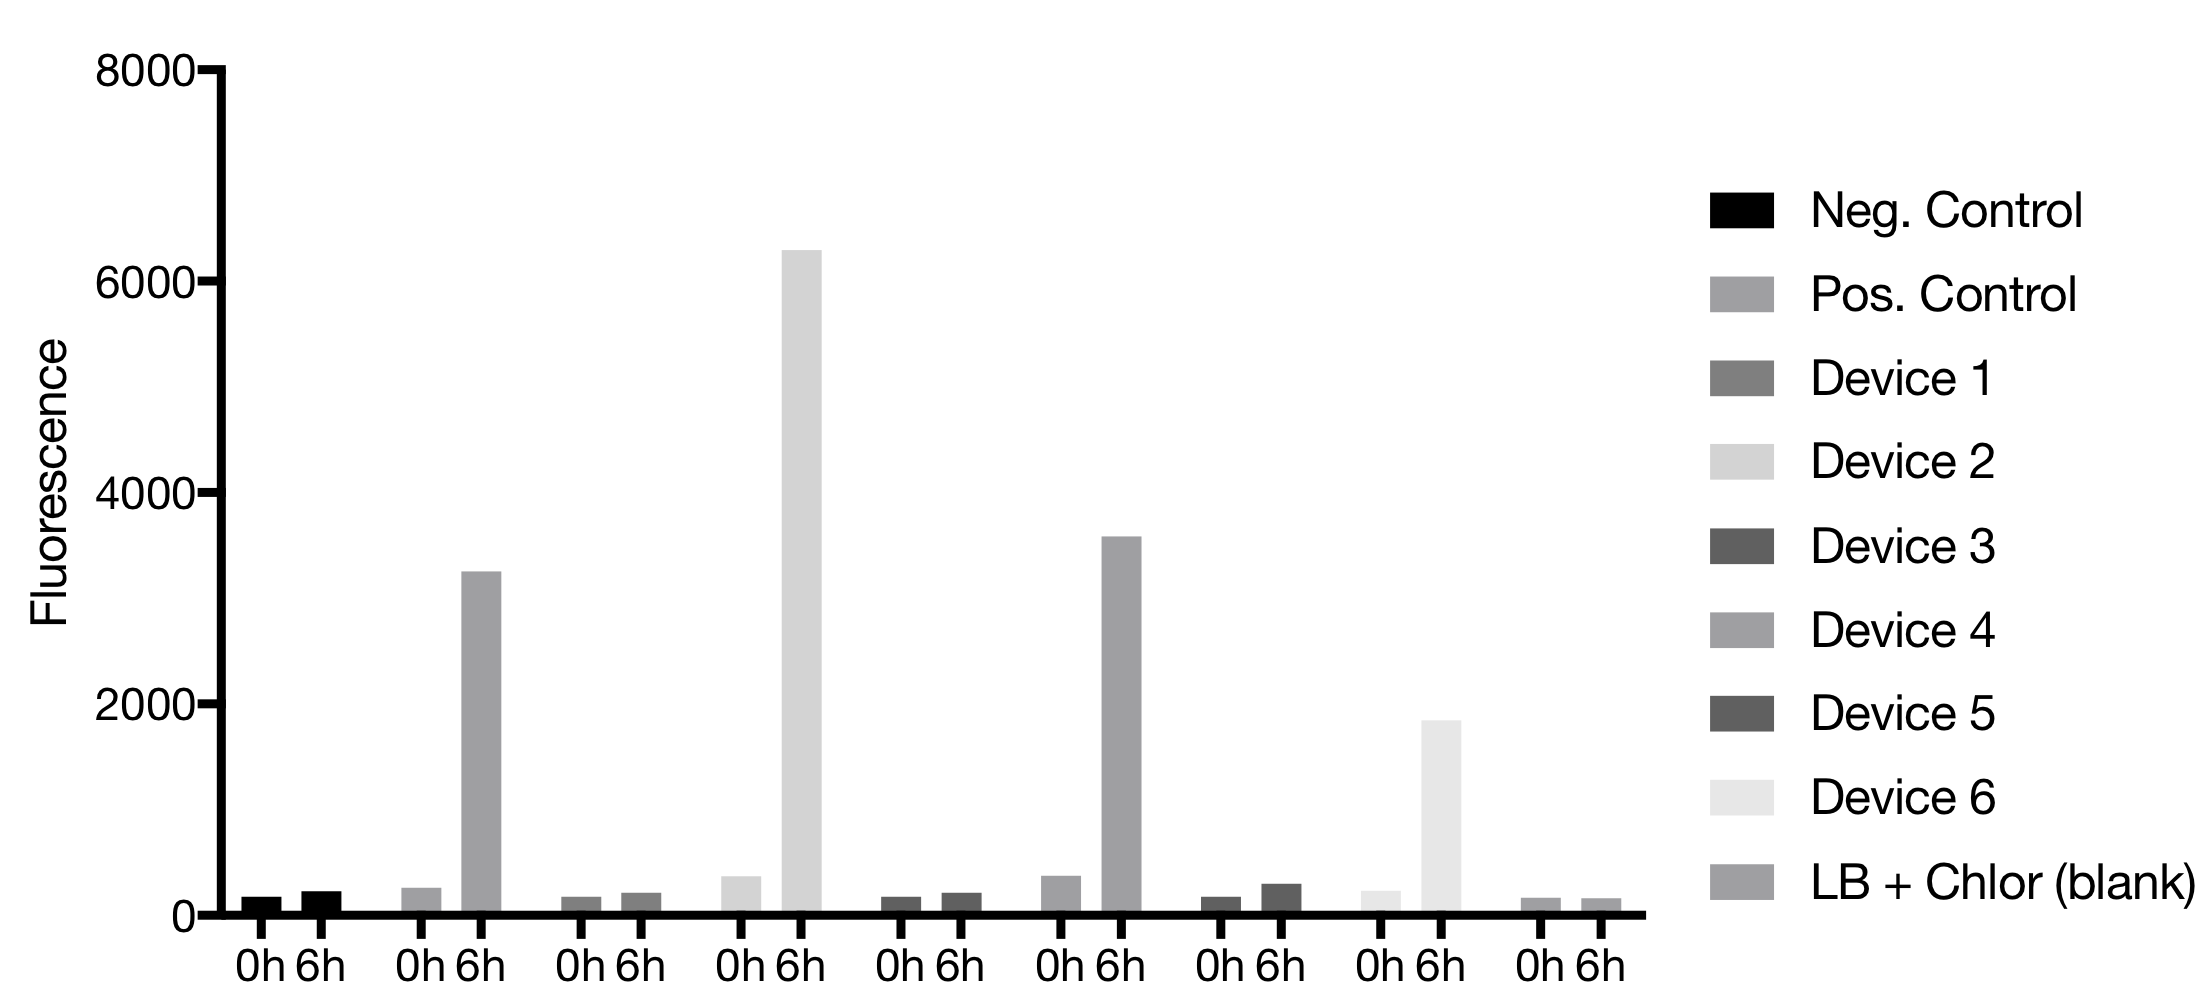
Conclusion
Device 2 showed the best fluorescence results, even better than the positive control. Device 4 was the second one with the highest emission. Device 4 also emitted fluorescence comparable to the positive control. Devices 3 and 5 showed no fluorescence. Device 1 showed no fluorescence but was reported to be a difficult plasmid before
[compare iGEM Munich 2017].Flow Cytometer Configurations
| Excitation Wavelength: | 488 nm |
|---|---|
| Trigger: | side scatter |
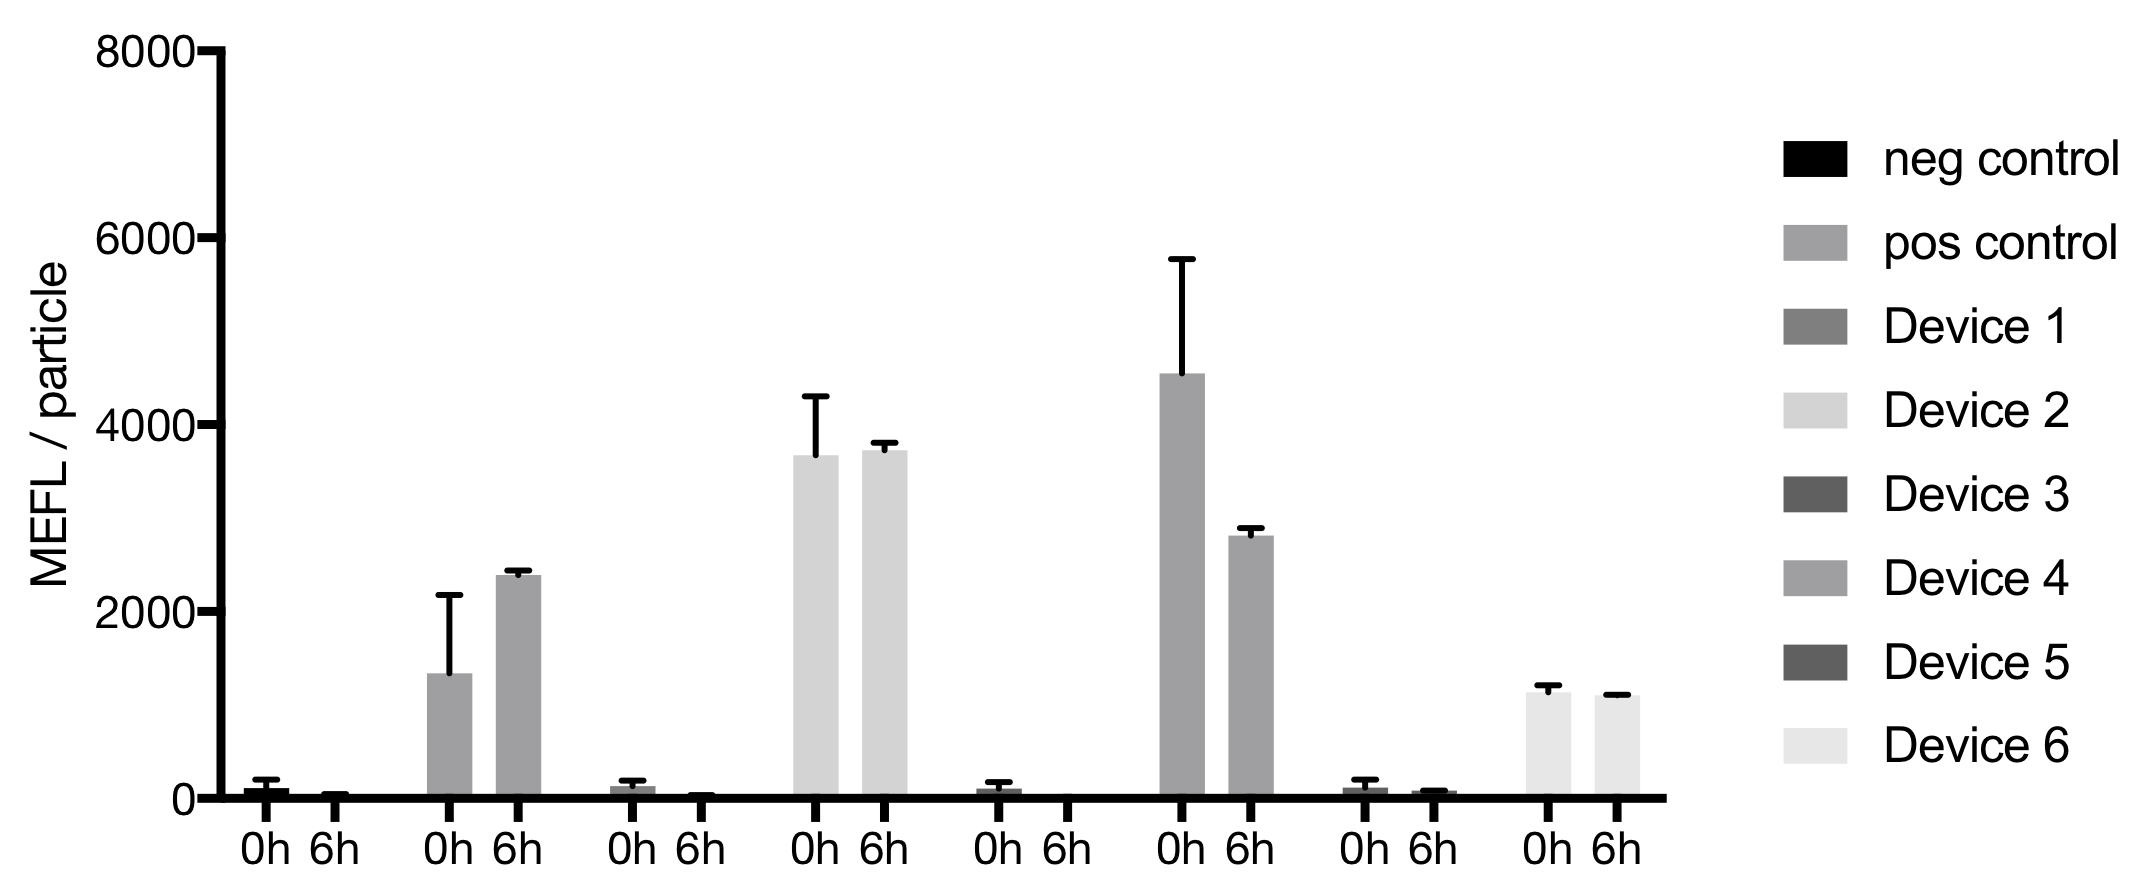
Results and Discussion
Data were collected for all devices at the start (0h) and the end (6h) of the experiment. The bacteria population can be differentiated from background events.


For the calibration particles RCP-30-5A a histogram with at least 7 peaks could be recorded. The particles did not show a discrete population in the forward vs. side scatter plot, indicating an aggregation of the particles.

Conclusion
No signals were detected for the negative control, Device 1 and Device 3 in rows A to D and the negative control, Device 3 and Device 4 in rows E to H respectively. This indicates that Device 1 and Device 4 were swaped accidentally in this rows. After 6h Device 4 and Device 5 displayed in the fluorescent histograms a mixed population.


