Phages are bacteria specific organisms, not harmful to humans and more specific than antibiotics. With Phactory it is possible to produce therapeutically relevant phages independent of the corresponding pathogen. This was done in our optimized home-made cell extract. With Phactory, we achieved a stable manufacturing process which produces phages with the titer and purity required for patient treatment.
Optimizing a Cell-Free Expression System
The first part of our project is the optimization of a cell-free expression system as a manufacturing platform for bacteriophages. For our purpose, it is necessary to produce a high-quality cell extract, in a reproducible and easy manner. We focused on achieving the following goals for our cell extract:
- increasing the protein content
- finding reproducible methods of quality control
- producing cell-extract that allows phage assembly
Considering a possible commercial application of our product we decided to furthermore evaluate the potential for scaling up of our preparation protocol.
We chose to try several different approaches to achieve these goals:
- testing cell cultivation in a bioreactor to enable upscaling
- finding optimal lysis conditions that produce high-quality extract
- scaling up of cell lysis
We found that:
- bioreactor cultivation allows for upscaling of cell extract production
- sonication and lysozyme improve the performance of cell extract
- cultivation and extract preparation barely impact cell extract composition
- lyophilization is a good choice for cell-extract storage
Bioreactor Cultivation Allows For Upscaling Of Cell Extract Production
Cultivating bacteria is the first step in cell extract preparation. The cell extract preparation protocol of Sun et al.1 uses shaking flask cultivation for biomass production. It recommends cell harvest in the mid-log growth phase at OD 1.8-2.0 to produce high-quality cell extract. We recorded growth curves for shaking flask cultivation and bioreactor cultivation in a lab-scale bioreactor, to compare biomass production under different culture conditions.

The growth curve from shaking flask cultivation revealed that the mid-log growth phase correlates to an OD of around 2. In bioreactor cultivation the mid-log growth phase is prolonged, due to the better aeration of the medium, and corresponds to an OD between 4 and 6. We harvested cells at OD 4, 5 and 6 to test which harvest point is most suitable to produce high quality cell extract.

The test revealed that the protein content is higher when cells were harvested at a higher OD, with OD 5 yielding the highest protein content. In addition, the cell extract from OD 5 produces the highest fluorescence intensity in the TXTL test. Compared to a cell extract from shaking flask cultivation the signal is reduced to about 60 %. The most likely cause for this result is that a higher fraction of proteins in the OD 5 cell extract is inactive, possibly due to protein damage during cell lysis (at the time of this experiment, cell lysis was not yet fully optimized).
The comparison of cultivation methods revealed that cultivation in a bioreactor is an applicable alternative to shaking flask cultivation and offers great potential for upscaling of cell extract preparation. In our 2 L lab-scale bioreactor we were able to produce 20 g of cell pellet, compared to 4-5 g that 2 L of shaking flask cultivation yield.
Sonication and Lysozyme Improve the Performance of Cell-Extract
Sonication
We tested three different cell lysis methods: beat beating, French press and sonication. Beat beating is an inexpensive and widely employed method but upscaling is problematic, and the preparation is tedious and time-consuming. High-pressure cell disruption in a so called ‘French-press’ is also used but these devices are very expensive and not widely prevalent. This contradicts our effort to provide a generally-applicable protocol for preparation of home-made cell extract. A sonication device on the other hand is available in most biochemical labs as it is a commonly used method for cell lysis in protein purification protocols. Nevertheless, we started by comparing all three lysis methods with settings commonly applied for cell lysis.
Our initial test showed that cell lysis by sonication yields extract with up to 2.8- and 4.4 fold higher expression than cell lysis by bead beating and French press respectively. These findings combined with the limited options of optimization for both bead beating and French press lysis as well as restricted potential for scaling up of bead beating, lead to the decision to focus our optimization efforts on sonication as lysis method.
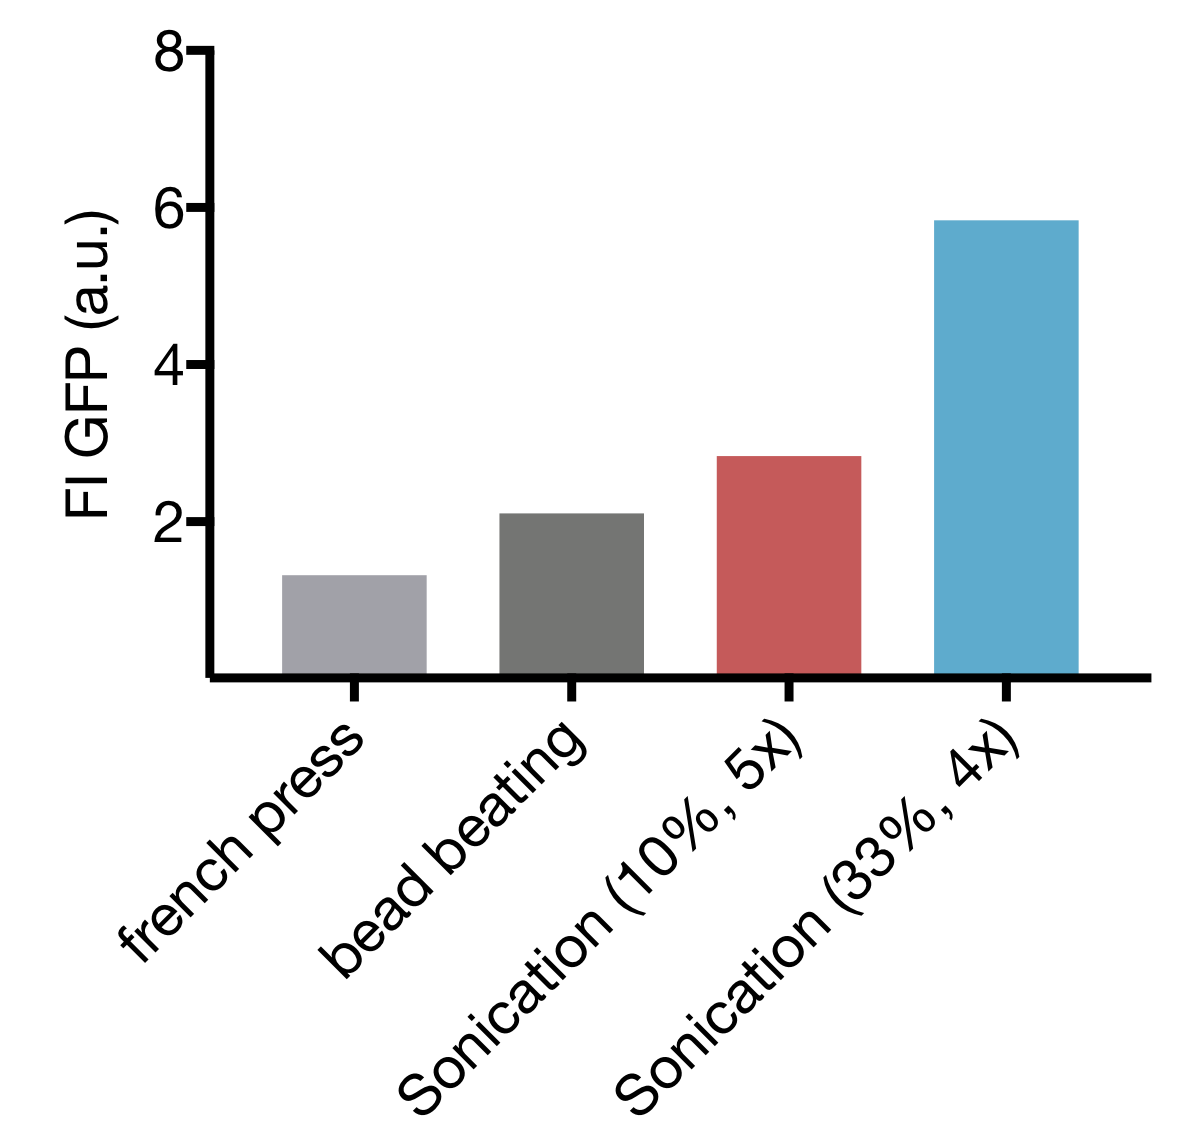
Comparison of different cell lysis methods for cell extract preparation.
Cell lysis by sonication has two main parameters that can be varied: the amplitude, which correlates to the power emitted by the sonication device and cycle number, representing the total time of sonication. Based on Yong-Chan Kwon & Michael C. Jewett2 we decided to use 10 s pulses with 15 s pause between pulses to prevent excessive heating of the sample.


Our screening revealed that increase in amplitude as well as increase in cycle number leads to higher protein content. The TXTL test showed high fluorescence intensity only for settings with low cycle numbers. This indicates that prolonged sonication damages the cellular machinery, reducing its ability for protein expression.
The highest-performing extracts were those obtained by sonication with 4 cycles at 33 % amplitude and 5 cycles at 10 % amplitude. Therefore, we focused our next steps on further optimization of those settings.
Lysozyme
In the last step we made an effort to scale up the sonication step. Preliminary experiments (results not shown) indicated 4 mL as the maximal sample volume that could be lysed efficiently with the device we had at our disposal. As indicated in the publication by Yong-Chan Kwon & Michael C. Jewett the number of sonication cycles was increased in proportion to the increase of sample volume. The presented results shown in the figure below show that this approach was successful: Using higher sample volumes for sonication increased protein content and expression quality of the cell extract. This proves that upscaling of cell extract preparation with cell lysis by sonication is indeed feasible.


Even though previous attempts by Shresta et al.3 to use Lysozyme in cell extract preparation have been unsuccessful, we tested the effect of adding the cell-wall degrading enzyme at 1 mM concentration to the cell lysis reaction. Across all our experiments, lysozyme increased the efficiency of cell lysis for all tested settings. Moreover, the expression quality was likewise increased after Lysozyme addition, indicating that the remaining enzyme does not interfere with protein biosynthesis.
Cell Extract Processing
Cultivation and cell lysis are the apparent most crucial steps in preparation of cell extract but there are other steps that can have a great impact on cell extract quality. Some of our findings regarding those steps are:
- Freezing cell pellets overnight for next-day processing does not interfere with extract quality but confers a major simplification of cell extract preparation
- Preliminary results indicate that omitting the run-off reaction after lysis does not significantly impair extract quality
- Dialysis of cell extract can be substituted by diafiltration in centrifugal filters without reducing the expression yield of the resulting extract
Characterizing Cell Extract Quality
In order to validate the success of our optimization efforts, adequate characterization of cell extract is indispensable. Here we will give a short review about the tools for quality assessment we implemented. Further details about characterization of these tools are available on the Measurement page.
We had initially defined increase of protein content in cell extract as optimization goal. However, as we realized early on, protein content alone is not a good measure for extract quality, because it provides no information about the activity of the cellular machinery.
To assess functionality of cell extract, testing of protein expression is necessary, which can be achieved by expressing fluorescent proteins and measuring the fluorescence time trace in a plate reader. To find the optimal quality control we compared the performance of different fluorescent proteins in cell extract.
We chose expression of mTurquoise – a variant of Cyan Fluorescent Protein (CFP) – as our favorite quality control for cell extract, as it results in high fluorescence intensity in a reproducible manner.

In addition, to examining protein expression we decided to analyze transcription uncoupled from translation by transcribing an RNA aptamer that binds a fluorescent dye.
We compared the fluorescence time trace of a Malachite Green binding aptamer in different cell extract samples. The fluorescence time traces decline after 30-50min, indicating that RNA degradation starts to prevail over transcription. Differences in the observed kinetics can be explained by variations in cell extract composition.
Cultivation and Extract Preparation Barely Impacts Cell Extract Composition
The main question was if the different performance of the cell extracts (P15, E10, myTXTL), especially concerning phage titers, is due to a divergent composition or caused by a discrepancy in activity of the relevant proteins e.g. transcription and translation related proteins Therefore, one student was sent to Bavarian Biomolecular Mass Spectrometry Centre (BayBioMS), where he analyzed the samples under the supervision of Dr. Christina Ludwig.
The results of the Mass Spectrometry gave us insight into the composition of the different TXTLs. We were able to identify 1771 proteins in all the extracts. The results indicate a high homogeneity between all three TXTLs, as illustrated in the heatmap. Based on the LFQ values (Label Free Quantification) a volcano plot of two samples (Arbor/E10, Arbor/P15 and E10/P15) was generated. In general, there is no protein more frequent in Arbor TXTL in comparison to E10 and P15. In contrast, some translation related proteins were slightly more abundant in E10 and P15 like certain tRNA ligases (PheS and PheT). The RecBCD subunits (the dsDNA degrading complex) is of similar abundance in all TXTLs, showing the importance to consider its negative impact on the assembly. The results were further validated with DAVID, a tool for finding metabolic pathways based on proteomic data. The identified pathways indicate no correlation with transcription/translation related pathways (data not shown).
We concluded that the performance difference is most likely due to decreased activity during TXTL preparation rather than a change in composition.


Lyophilization Is a Good Choice for Cell-Extract Storage
With regard to global application of Phactory it is crucial to enable long-term storage and shipping of our cell extract. In order to fulfill these requirements, we chose to freeze-dry our cell extract. Lyophilized extract can be stored at ambient temperature and can be reactivated by addition of only nuclease-free water. Initial tests for the optimal lyophilization conditions revealed several important points:
- cell extract quality is only preserved when cell-extract is mixed with the TXTL reaction buffer prior to lyophilization
- the preservation of quality does not depend on the size of lyophilized extract aliquots
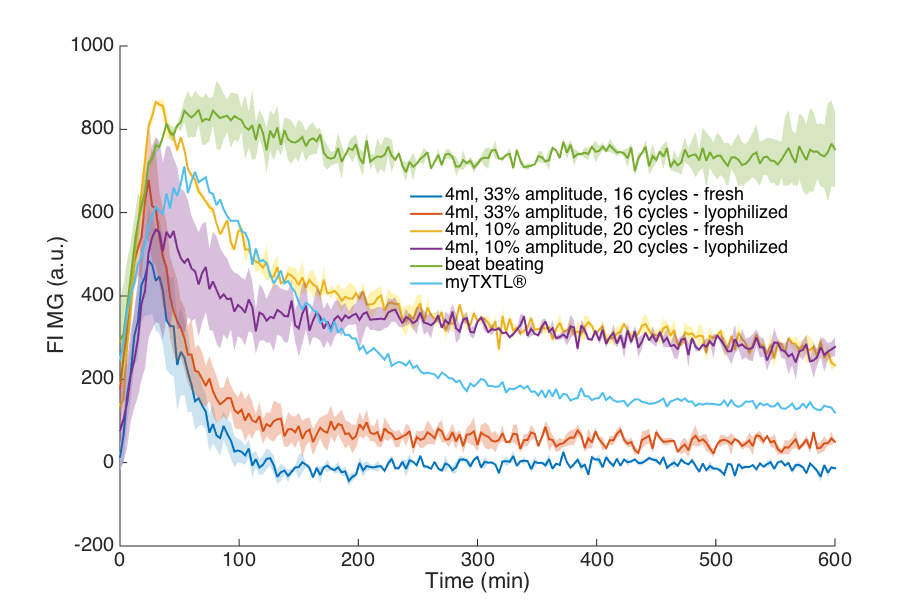
We tested the expression quality of several of our home-made cell extracts from fresh and lyophilized aliquots. This comparison also includes the commercially available myTXTL® cell-free expression system (arbor biosciences) and highlights two important results of our efforts to optimize production of cell extract:
- our improved cell extract can be lyophilized and retains 40-70 % of its performance
- our final settings for cell extract preparation yield extract that clearly outperforms the commercial system, with up to 9-fold higher protein expression

Synthetic Phage Manufacturing
Phages were manufactured based on three components: the cell extract, an energy solution (ATP, GTP, NAD+ etc.) and a supplement solution (amino acids, tRNAs, pholic acid etc.). The only additional component for phage assembly is pure phage DNA. We expanded the assembly platform by
- producing the first clinically relevant phages at therapeutic concentrations
- manufacturing of therapeutic phages independent of a living pathogen
- achieving similar phage titers as the commercial cell extract
- determining the amount of DNA necessary for sufficient phage assembly
- calculating the amount of DNA produced in the cell extract by replication
DNA Purification
An essential part of bacteriophage manufacturing is the DNA. We extracted it by Phenol-Chloroform precipitation. The Purification was controlled with an agarose gel, where two distinct bands (the proper high-mass band and a low-mass band) were present for all four samples.
To reduce the amount of the low-mass bands, the protocol was changed to a column-based technique. With this technique the incorrect band was significantly reduced in all samples, which was proven with an agarose gel.


Home-Made Cell Extract Achieves Phage Titer Comparable to the Commercial System
We determined the concentration of phages assembled in our cell extracts P15 and E10, which had the most promising results in our cell extract quality control. We compared our extracts to the commercial extract (myTXTL) and saw a similar performance.
All in all, our extract has the same phage assembly potential as the commercial cell extract. Moreover, lyophilization, which makes the cell extract better storable, does not reduce the efficiency of bacteriophage assembly. We concluded that phages could be assembled on site in a durable lyophilized cell extract.

Bacteriophages Can Be Assembled Independent of the Living Host
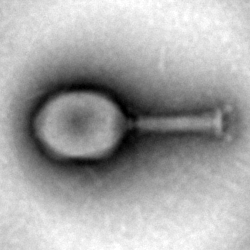
Phactory has the ability to assemble various bacteriophages, in a bacteria-independent manner. To underline this feature and demonstrate universal applicability, we assembled a variety of different E. coli phages, both DNA and RNA-based.
The successful assembly of all phages was confirmed by plaque assay and transmission electron microscopy (TEM). In addition, DNA encoding for NES and FFP phages was used to perform assembly of these phages in our cell extract. However, we were not in possession of the respective host bacterial strains and therefore could not demonstrate successful assembly.
Pathogenic bacteria such as salmonella, pseudomonas and staphylococcus are prone to develop multi-drug resistance and pose an urgent or serious threat (Centers for Disease Control and Prevention, 2013. Antibiotic/Antimicrobial Resistance.). Therefore, to fulfill this medical need, phages specific for these bacteria should be assembled next in our cell-free system.


DNA Concentration Determines Phage Titer
Bacteriophage Titers Correlate With DNA Concentration
To prove the influence of the DNA concentration on the bacteriophage titer, cell extract reactions were prepared with varying T4 DNA concentrations. The bacteriophage production was performed. The titer of the bacteriophages was measured with the top agar method and the formed plaques were counted. The increase in DNA concentration results in an increase in the bacteriophage concentration. This increase is nonlinear as our model predicted. This finding is probably due to a critical concentration of phage proteins, which have to be reached for capsid head assembly (similar to a critical micelle concentration).


Cell-Free Systems Replicate Phage Genomes
The DNA sequence added to the cell-free system serves as the template for the required phage. We saw, that DNA-Polymerases can amplify the DNA segment, multiplying the amount of DNA in the cell-free reaction.4
To assess this effect and its dependence on deoxynucleotide triphosphates (dNTPs), we performed an absolute quantification of T7 DNA in the cell-free reaction by quantitative PCR (qPCR). A standard curve with a serial dilution of T7 DNA. We used the TXTL qPCR protocol (add link). We used two selected cell extracts (P15 and E10), which reached similar phage titers compared to the commercial cell extract (myTXTL) in previous experiments. We compared the replication potential in comparison to myTXTL.
The addition of dNTP to the reference reaction leads to an increase in DNA concentration by a factor of 15 in the reaction after 4 hours (290 ng compared to 19 ng). This is higher than in the myTXTL reaction without additional dNTPs, where a 1.8-fold increase in DNA (91 ng compared to 51 ng) after the 4-hour reaction is observed. The home-made cell extracts P10 and E15 however do not resemble this behavior.
It would be desirable to increase DNA amplification in our cell extracts. We therefore conducted a cause analysis, focusing on the T7 replication system. A more than 250-fold increase in processivity of the T7 DNA polymerase is achieved by its binding behavior to E. coli thioredoxin1. We suspected reduced presence of this factor in our cell extract. Thioredoxin could be added to a phage assembly reaction to further test these assumptions. However, our proteome analysis did not confirm that there were low levels of thioredoxin present in our cell extract.

Modular Bacteriophage Composition
Bacteriophage modularity can be achieved by protein engineering without changing the genomic DNA of the bacteriophage and synthetic genome engineering.
Protein engineering

In the TXTL system, it should be possible to modify phage proteins without altering their genome. This was attempted by modifying HOC (highly immunogenic capsid protein), which is part of the capsid protein structure of the T4-phage. Therefore, His-TEV-YFP-HOC was separately expressed and the purified protein was applied to our phage assembly.5
For protein modification of the T4 capsid protein HOC, a plasmid for protein expression was cloned and His-YFP-HOC (82kDa) was expressed. The plasmid was transformed into BL21, expressed and purified by nickel affinity chromatography and gel filtration.

After the two chromatography steps, the purified protein had a final concentration of 70µM and no by-products were visible by silver staining. The CD-spectra (minima of 218nm) of the protein corresponds to the model and the Ramachandran plot indicates that the protein was not denatured during purification. Then, the purified protein was intentionally denatured by thermal transition. Thereby, it was confirmed that the protein is stable below 40°C. This is of importance, as phage assembly is performed at 29°C.


The purified protein was added to the assembly mix. Bacteria were transfected with the modified phages. Unbound phages and protein were removed by centrifugation. Fluorescence was measured in dependence of the proximity to the bacteria. Theoretically, YFP intensity should correlate with the binding of YFP-HOC modified phages to the bacteria.


Purification of the modified T4 bacteriophage
To show the possibility of our manufacturing system we modified our T4 bacteriophage at the Hoc protein with the fusion of a His-YFP. In this experiment the His-tag was utilized to purify the bacteriophage solution from the cell extract after the assembly process.
The bacteriophages with the His-tag, were loaded on Ni-NTA beads which where embedded in chromatography columns. After four subsequently washing steps imidazole was used to elute the His-tag from the beads. As a negative control, bacteriophages without a His-tag were treated equally.
To test the purification a spot assay was performed. On the left there are the T4 bacteriophages which were eluted from the sample with the His-Tagged bacteriophages and on the right side there is negative control with the native eluted bacteriophages. The titer of the bacteriophages is lower in the right sample, due to the fact that single plaques are visible, which indicates a low concentration. In contrast the His-tagged bacteriophages, which have a higher concentration, were only one large lysis area is visible.

Phage Genome Engineering
An additional advantage of Phactory is the possibility of rebooting bacteriophages from their genomic template, which is especially important for genetic engineering of bacteriophages. With home-made cell extract it was possible to manufacture an engineered MS2 RNA phage, where a polyhistidine-tag was added on the phage RNA polymerase. The genomic template was generated via gibson assembly and PCR amplification. After purification of the engineered genome, phages were assembled in our self-made P15 cell extract. A plaque assay confirmed the successful assembly of functional phages with a titer of 3 × 10⁷ PFU/ml.
To test the his-tag modification, the Phages were amplified in a bacterial culture flask. After lysis of the bacteria the tagged polymerase was purified from the supernatant by nickel affinity chromatography. An SDS-PAGE proved that the 62 kDa Protein remained in the Nickel column due to the successfully engineering of an inserted His-tag.

Quality Control
Quality control covers several aspects of phage manufacturing including phage functionality, endoxin levels and DNA purity. We found that
- we are able to produce functional phages in our cell extract
- the cell extract of our optimized strain has an endotoxin content below the detection limit and our regular self-produced cell extract has fewer endotoxins than the commercial cell extract
- next-generation sequencing allowed us to accurately quantify contamination
- phenol-chloroform extraction leads to a large amount of contaminating DNA which complicates phage assembly
- next-generation sequencing helped us to improve our purification protocols, leading to improved phage assembly
Assessing Phage Functionality by Plaque Assays
We performed a Plaque Assay to determine the activity of the viable phages (titer) in our assembly batch. By creating serial dilutions, we were able to calculate a plaque forming units/milliliter (PFU/ml) value. The plaque assay protocol was used.


Assessing Endotoxin Levels
Msb-B Knockouts Reduce Endotoxin Levels By 49-Fold
Endotoxins are pyrogens deriving from gram-negative bacteria. Their removal from any pharmaceutical product is mandatory. Therefore, we engineered an E. coli strain lacking lipid A, a major endotoxin component and used this bacterium to produce our cell extract. To evaluate endotoxin content of different cell extracts, a Limulus Amebocyte Lysate (LAL)-test was performed according to the supplier manual. As a reference, we compared the cell extract from our msbB-deficient strain (K2) to a cell extract from a wild-type strain (K4) as well as a commercial cell-free system (myTXTL, Arbor Biosciences). A solution with lysed E. coli served as a positive control.
Compared to the K4 strain our msbB-deficient K2 cell extract had 49-fold reduced endotoxin levels (0.06 EU/ml compared to 2.94 EU/ml). Other cell extracts such as the P15 cell extract (3.83 EU/ml) and the commercial myTXTL (4.65 EU/ml) had even higher endotoxin contents.

A calibration curve using known endotoxin concentrations is required for the LAL-Test. A dilution series ranging from 0.625 EU/ml to 5 EU/ml. The fitting curve is used to interpolate the concentrations in the unknown sample. The linear fit of the calibration curve had a R2 of 0.98, an intersection with the y-axis at 0.38 and a slope of 0.39 ml/EU. These values are in accordance with the requirements of the LAL-Test manufacturer.
Removal of endotoxins is impeded by their tendency to form stable interactions with other biomolecules. Our method of preventing the lipid A biosynthesis is therefore superior to extensive isolation steps required for removing endotoxins in conventional phage production.
Nanopore Sequencing Enhances DNA Purification
Besides the cell extract, the DNA quality is the key to phage assembly. Impure DNA (Host DNA, proteins contamination) complicates the assembly of the phage within the cell lysate. A highly sensitive method to measure DNA is Oxford Nanopore sequencing.6
Our first attempts with classical chloroform/phenol extraction failed because of low molecular DNA (agarose gel). Therefore, we decided to search for other purification protocols, DNAse I and the Norgene kit (46800) tremendously increased DNA purity. With this DNA, we were able to achieve high titers by assembly.

Sequ-Into Allows For Accurate Detection of DNA Contamination Levels
| Experiment | Sequencing Time | Reads Sequenced | Base-pairs sequenced |
|---|---|---|---|
| T7 | 12h 02min | 424,198 | 1.27 × 10⁹ |
| 3S | 3h 42min | 77,092 | 2.53 × 10⁸ |
| NES | 3h 58min | 39,501 | 2.31 × 10⁸ |
| NFFP | 5h 42min | 27,633 | 1.23 × 10⁸ |
The main task after receiving genomes was to assemble the phage genomes from the Nanopore reads without the reference genome and gain the origin sequence. There are several tools available but for minION Nanopore recommended tools are "canu" and "miniasm" of which we used the latter.
Despite an excellent lab team, we have been confronted with a major problem: contamination. Contamination is a problem regarding the therapeutic usage of the bacteriophages, but also an important factor in any bioinformatics pipeline because contamination-based reads can confuse the assembly process. We thus developed Sequ-Into to detect the contamination and also get rid of contamination-originated reads. In the context of our project, several DNA purification protocols were evaluated with Sequ-Into. This allowed iterative engineering cycles in Phactory, leading to unparalleled purity of up to 96% (bases sequenced).
While evaluating the sequencing data with Sequ-Into, we noticed that in the first 10% of the sequencing time of each experiment, more non-target reads were sequenced than in any latter time interval. Moreover, we found that this also holds true for the first x sequenced reads, which allowed us to setup sequ-into such that it only analyses the first 1000 reads of a minION sequencing experiment, speeding up computation and enabling en-run analysis.

After getting rid of the contamination, we noticed a non-uniform coverage in the phage genome assemblies after re-aligning the reads to the assembly.
Rearranging the middle part which initially was “over-expressed” and re-assembling led us to the expected uniform coverage of the de-novo genome sequence after re-aligning the input reads. Finally, we could predict coding-sequences and visualize all descriptive statistics in genome diagrams.


More details at Data Analysis page.
Encapsulation
After successful bacteriophage production and toxicity evaluation the final step of the manufacturing pipeline is therapeutic application. By nature, bacteriophages possess a relatively short have-life when orally administered. Encapsulation in alginate negates this effect by protecting phages from gastric fluid. 7
We constructed a simple device that allows us to encapsulate our bacteriophages in alginate droplets.
Droplets are Monodisperse


In order to achieve defined phage concentrations and therefore defined doses, we optimized the monodispersity of our alginate droplets.
In our initial attempts to create alginate droplets the size within a batch often varied significantly. Additionally, a lot of droplets were lost due to aggregation. Optimization of parameters such as flow rate, alginate concentration and N2 pressure led to an increase of monodispersity for all tested sizes (50-300 μm). Specifically, an alginate concentration of 1.8 % alginate and 0.2 % low-viscosity alginate proved to be ideal. Pressure and flow rate determine the droplet sizes and can be varied.

Bacteriophages Encapsulated In Alginate Can Withstand Gastric Acid
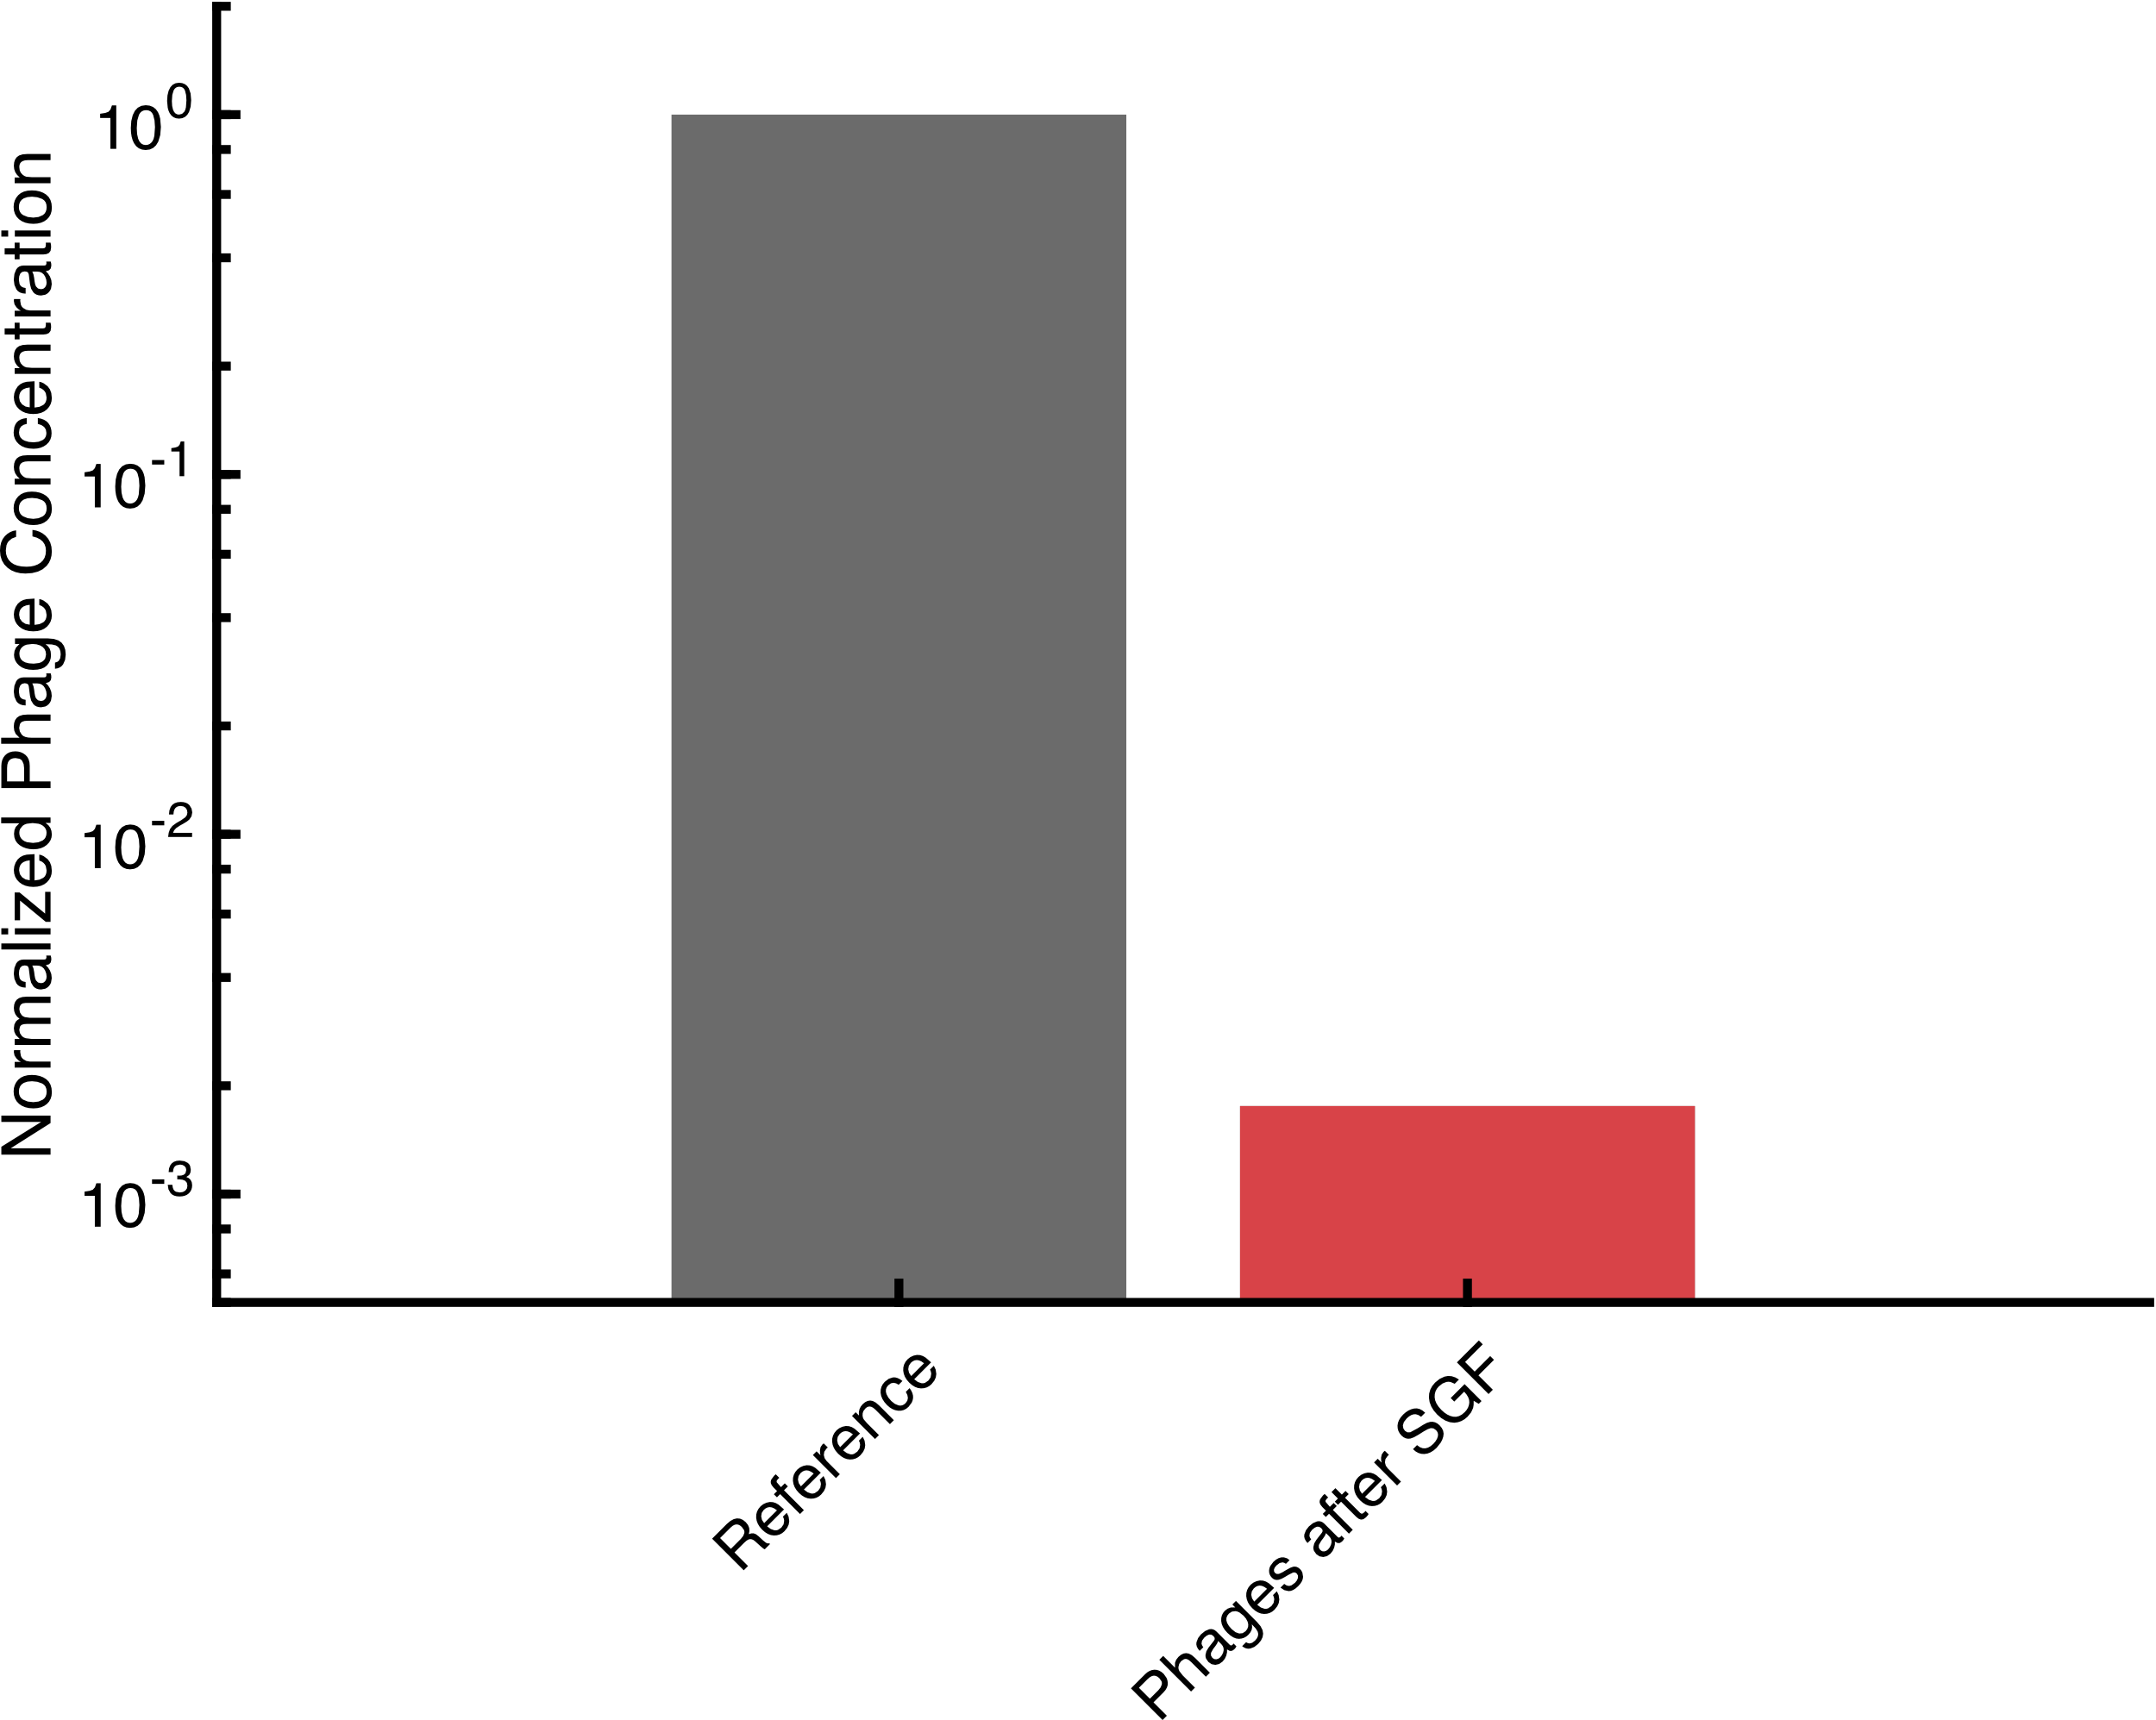
The main problem of oral application is the acidic environment in the gastric fluid, necessitating protective measures against degradation. The other requirement of phage protection is the release of functional phages in the intestine. For this reason, we compared the behavior of the encapsulated phages and non-encapsulated phages in simulated gastric fluid (SGF) and simulated intestinal fluid (SIF).
In SGF, the number of active non-encapsulated phages decreases by more than 99.99 % within an hour. This shows the urgent need of a form of protection. As a reference, we used phages that were chemically released by citrate from alginate droplets.
In comparison, the encapsulated phages were tested in SGF for the same time as the non-encapsulated phages. Afterwards, the same droplets were exposed for two hours to simulated intestinal fluid to test the release of functional bacteriophages in this environment.
The encapsulated phages were hardly released in a timeframe of one hour when exposed to SGF. After transferring the capsules to SIF the number of active phages reached that of the reference. This indicates that the encapsulation of bacteriophages in alginate capsules enables the possibility of an oral application. Further experiments could test the alginate capsules in an animal model system.

References
- Sun, Zachary Z., et al. "Protocols for implementing an Escherichia coli based TXTL cell-free expression system for synthetic biology." Journal of visualized experiments: JoVE 79 (2013).
- Kwon, Yong-Chan, and Michael C. Jewett. "High-throughput preparation methods of crude extract for robust cell-free protein synthesis." Scientific reports 5 (2015): 8663.
- Shrestha, Prashanta, Troy Michael Holland, and Bradley Charles Bundy. "Streamlined extract preparation for Escherichia coli-based cell-free protein synthesis by sonication or bead vortex mixing." Biotechniques 53.3 (2012): 163-174.
- Modrich, P., and C. C. Richardson. "Bacteriophage T7 deoxyribonucleic acid replication invitro. Bacteriophage T7 DNA polymerase: an an emzyme composed of phage-and host-specific subunits." Journal of Biological Chemistry 250.14 (1975): 5515-5522.
- Sathaliyawala, Taheri, et al. "Assembly of human immunodeficiency virus (HIV) antigens on bacteriophage T4: a novel in vitro approach to construct multicomponent HIV vaccines." Journal of virology 80.15 (2006): 7688-7698.
- Maitra, Raj D., Jungsuk Kim, and William B. Dunbar. "Recent advances in nanopore sequencing." Electrophoresis 33.23 (2012): 3418-3428.
- Colom, Joan, et al. "Microencapsulation with alginate/CaCO 3: A strategy for improved phage therapy." Scientific reports 7 (2017): 41441


