Team:NYMU-Taipei/Model

FRET Ratio Model


Background
This model aims to find out how much FRET protein should be added into our screening system.
Methods
Chemical equilibrium is used to determine the concentration of each protein, the fluorescence level, and the minimal FRET protein activity required to produce the fluorescence that can be detected. This model assumes the portion of active protein in all proteins is constant. The equilibrium constants are from Victoria E. Ahn's study [1] and Zhihong Cheng's study [2]. The limited experiment budget for making FRET proteins is considered in this model.
Results
The relationship between fluorescence and DKK1 expression level
The relationship between fluorescence and the activity of one of the FRET proteins
The plot of the optimal activity of a FRET protein vs. the other
3D plot of the fluorescence, the objective function we want to maximize.
The x-axis is the concentration of one of the FRET protein and y-axis is that of the other FRET protein.

Contour a plot of the fluorescence, the objective function we want to maximize.
The x-axis is the concentration of one of the FRET protein and y-axis is that of the other FRET protein.

A plot of the optimal “cheaper FRET protein” activity, vs. budget
A plot of the optimal “more expensive FRET protein” activity, vs. budget
A plot of the optimal ratio vs. budget
Kd values obtained from the references:

Conclusion
The optimal ratio of the amount of one FRET protein to that of the other is as the following:

The figures in the table indicate the optimal ratio of the protein on the top over the protein on the left.
Click Here For More Info
FRET Efficiency Model

Background
The efficiency of FRET is inversely proportional to the sixth power of the distance between donor and acceptor, making FRET extremely sensitive to small changes in distance. Therefore, simulating structure of protein-protein interactions is important. This model aims to predict the FRET efficiency in order to determine which molecules and which termini should be used.
Methods
pyDockWEB [3] is used for structural prediction of protein-protein interactions and the prediction of distances between donor and acceptor. Förster theory is used to determine the FRET efficiency. YPet and CyPet are added to either N-terminus or C-terminus of each of the 2 FRET proteins.
Results
The protein-protein interactions structural predictions are as follows:
Cyan: LRP6-BP1BP2 Green: LRP6-BP3BP4 Purple: DKK1

Cyan: LRP6-BP3BP4 Green: VHH G5 Purple: DKK1

Cyan: VHH H7 Green: VHH G5 Purple: DKK1
The predicted distances are
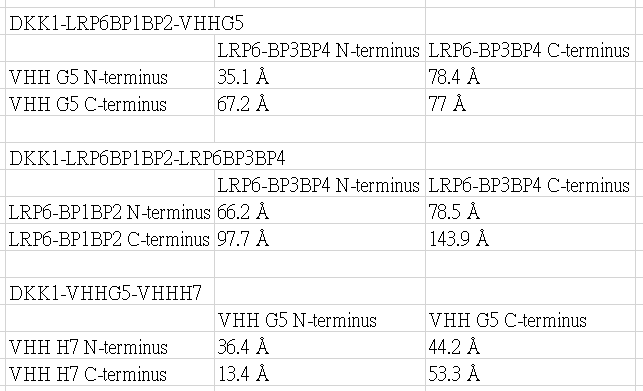
YPet and CyPet are added to the N-terminus or the C-terminus.
Conclusion
The FRET efficiency is given by the following table.
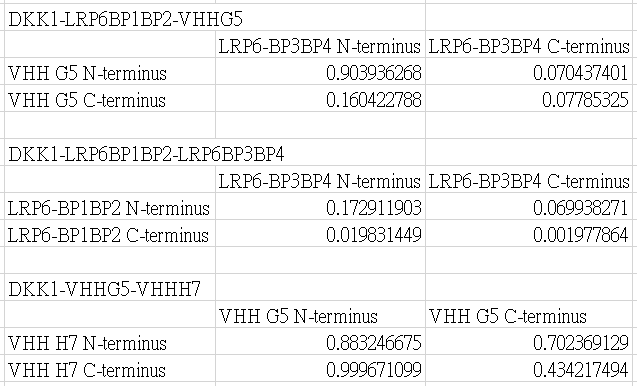
YPet and CyPet are added to the N-terminus or the C-terminus.
Click Here For More Info
DKK1-E3E4G5.pse
DKK1E1E2E3E4.pse
DKK1E3E4.pdb
DKK1E3E4H7.pdb
DKK1G5H7-model-1.pse
mCherry Expression Model


Background
This project constructs a plasmid that connects DKK1 promoter to mCherry. The gene expression rate of DKK1 promoter is affected by testosterone activity and affects the expression level of mCherry. The expression level of mCherry should be greater than a threshold so that its fluorescence can be detected by devices. In order to achieve this threshold, sufficient amount of testosterone should be added into our screening system; this is the sensitivity of our screening system. This model aims to find out the sensitivity of our screening system.
Methods
This model simulates the kinetics of transcription signal the expression of DKK1 promoter. The process of protein synthesis is simulated with differential equations, assuming the synthesis of mCherry follows the central dogma of molecular biology. Signaling pathways of the androgen receptor is modeled based on chemical equilibrium of each transcription factor and intermediate.
Results
The increment of DKK1 gene expression rate caused by effective DHT activity
Expected DKK1 protein expression level: [DKK1] = 5 + 0.006 [DHT]2
where [DKK1] indicates DKK1 activity in ng/ml and [DHT] indicates DHT activity in nM.
Note: This is accurate only when [DHT] is less than 50 nM. [5]
Conclusion
[mCherry] = c1 + c2 [Testosterone]2
where square brackets indicate activity in M, and c1 and c2 are constants to be determined.
Note: This model is accurate only when [DHT] is less than 50 nM. [5]
Click Here For More Info
References
- Victoria E. Ahn et al (2011). "Structural basis of Wnt signaling inhibition by Dickkopf binding to LRP5/6." Dev Cell . 2011 November 15; 21(5): 862–873.
- Zhihong Cheng (2011). "Crystal structures of the extracellular domain of LRP6 and its complex with DKK1." Nat Struct Mol Biol. 2011 Oct 9;18(11):1204-10.
- Jiménez-García B, Pons C, Fernández-Recio J. (2013). "pyDockWEB: a web server for rigid-body protein-protein docking using electrostatics and desolvation scoring." Bioinformatics. 2013 Jul 1;29(13):1698-9.
- Meehan KL1, Sadar MD. (2003). "Androgens and androgen receptor in prostate and ovarian malignancies." Front Biosci. 2003 May 1;8:d780-800.
- Kwack MH, Sung YK, Chung EJ, Im SU, Ahn JS, Kim MK, Kim JC. "Dihydrotestosterone-inducible dickkopf 1 from balding dermal papilla cells causes apoptosis in follicular keratinocytes." J Invest Dermatol. 2008 Feb;128(2):262-9.