Team:RDFZ-China/Model
Modelling
Bound Fraction & Unbound Fraction
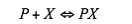
By defining a simple equation where P is the promoter region and X is the ligand that can bind with P, which is an activator or a repressor:
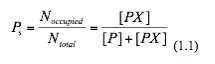
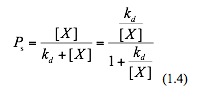
The factional saturation of the promoter is denoted by Ps , which is the fraction of occupied binding sites:
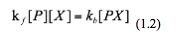
At equilibrium of this reaction, the rate of forward reaction and that of backward reaction are the same:
Then we rearrange this equation and get:
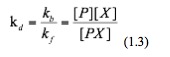
Where kd is the dissociation constant of this binding event. Now we substitute equation 1.3 into equation 1.1 and hence obtain:
Assuming that the sum of the bound and the unbound equals one, the unbound fraction Pu is thus:

Bound fraction is considered for activation in gene regulation and unbound fraction for repressive regulation.
Modelling Equations
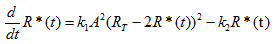
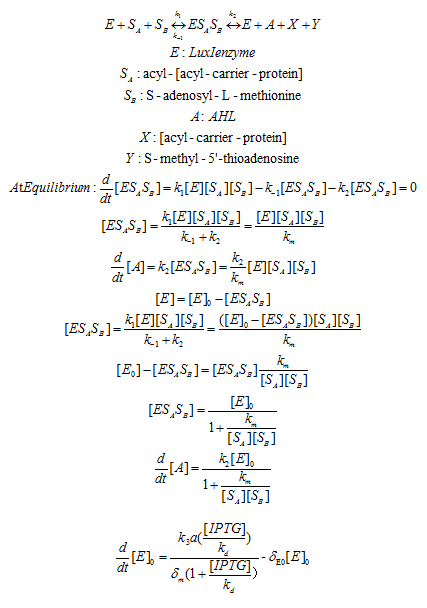
The chemical AHL (A) is required by LuxR to activate transcription. The active form for LuxR it consists of a dimer of the complex LuxR-AHL ((Y:A)2). Thus we can consider the production of this dimer as an elementary reaction: 2A+2Y --> (Y:A)2, whose rate depends upon A, the concentration of AHL, and the concentration of unbound LuxR monomer, Runbound.
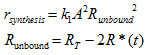
Where synthesis is the rate of synthesis of the dimer, k1 is the binding coefficient RT is the total concentration of LuxR monomer, and R*(t) is the concentration of AHL-LuxR dimer. And k2R*(t) is simply the rate of degradation of the dimer, where k2 is the degradation coefficient of AHL-LuxR.
For any given mRNA:
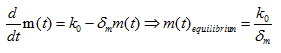
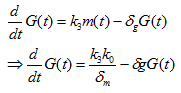
Where m(t) is the concentration of mRNA, k0 is the amount of mRNA produced, δm is the degradation rate of mRNA. For PhIF protein translated from the given mRNA:
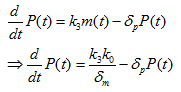
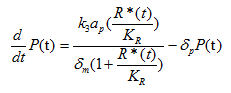
Where P(t) is the concentration of PhIF protein, k3 is the translation rate, and δp is the degradation rate of PhIF protein. Then substitute equation 1.4 into the calculation of k0 (for the activation of Plux promoter by AHL-LuxR correspond to bound fraction):
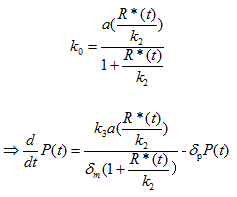
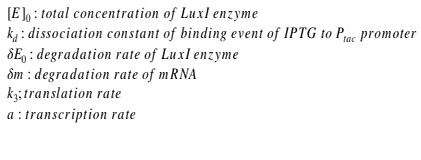
Where a is the transcription rate, k2 is the equivalent of kd in equation 1.4 and 1.5.
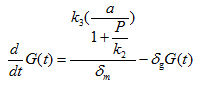
For sfGFP protein translated from the given mRNA:
Where G(t) is the concentration of sfGFP protein, k3 is the translation rate, and δg is the degradation rate of PhIF protein. Then substitute equation 1.5 into the calculation of k0 in this case (for the repression of PPhIF promoter by PhIF protein correspond to the unbound fraction):
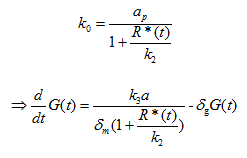
Where a is the transcription rate, k2 is the equivalent of kd in equation 1.4 and 1.5.
Methods&Results
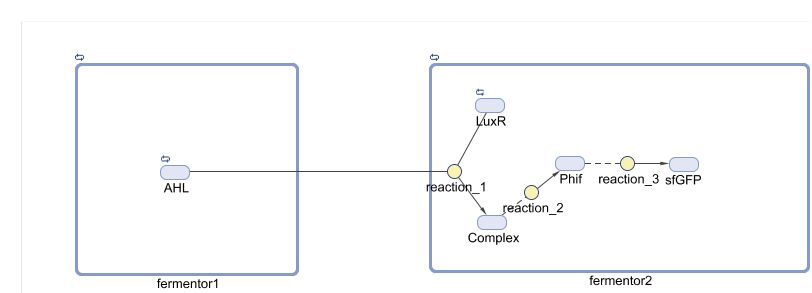
To simulate our model, we use the Matlab ODE suite to solve three differential equations simultaneously. A breif diagram of the regulatory network can be found below:
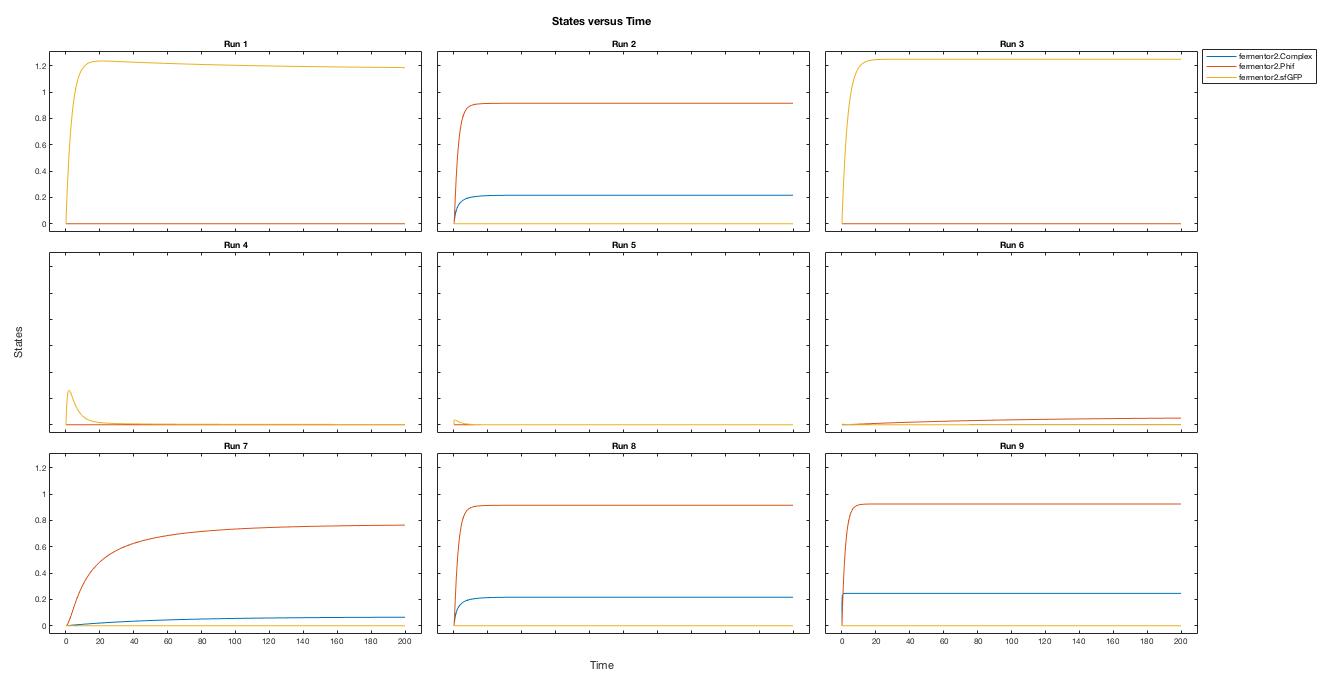
By adjusting the initial dose of AHL, ranging from 10^-5 M to 10^-12 M , we can get a variance of dose response below:
From the simulation results, we can see that between [AHL]=10^-10 and 10^-11 M, the concentration of the sfGFP(which represents ccdb) rises above 5*10^-8M which gives the half maximal killing rate, meaning a large proportion of bacteria in the fermentor would die. Therefore, the worker in the factory should always be aware not having [AHL] below that range.
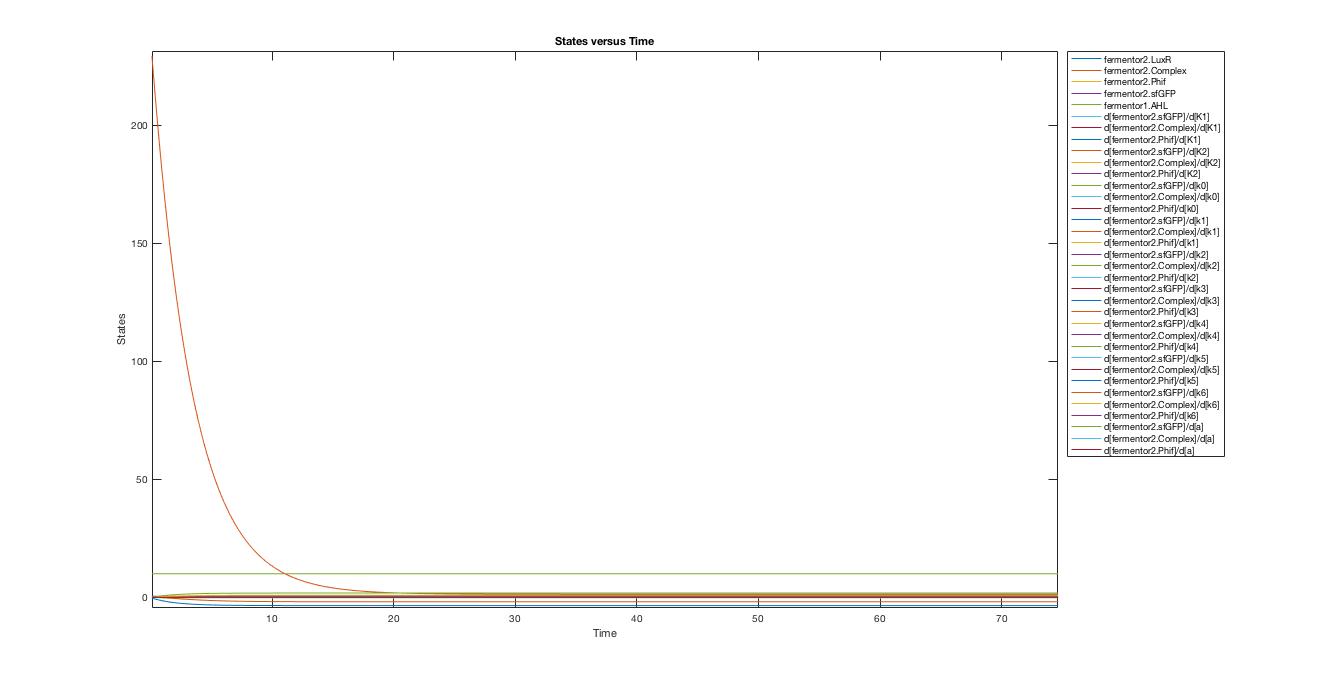
A local sensitivity analysis is also carried out to help us increase the robustness of the model. Two influential factors are selected to perform a further parameter scan.
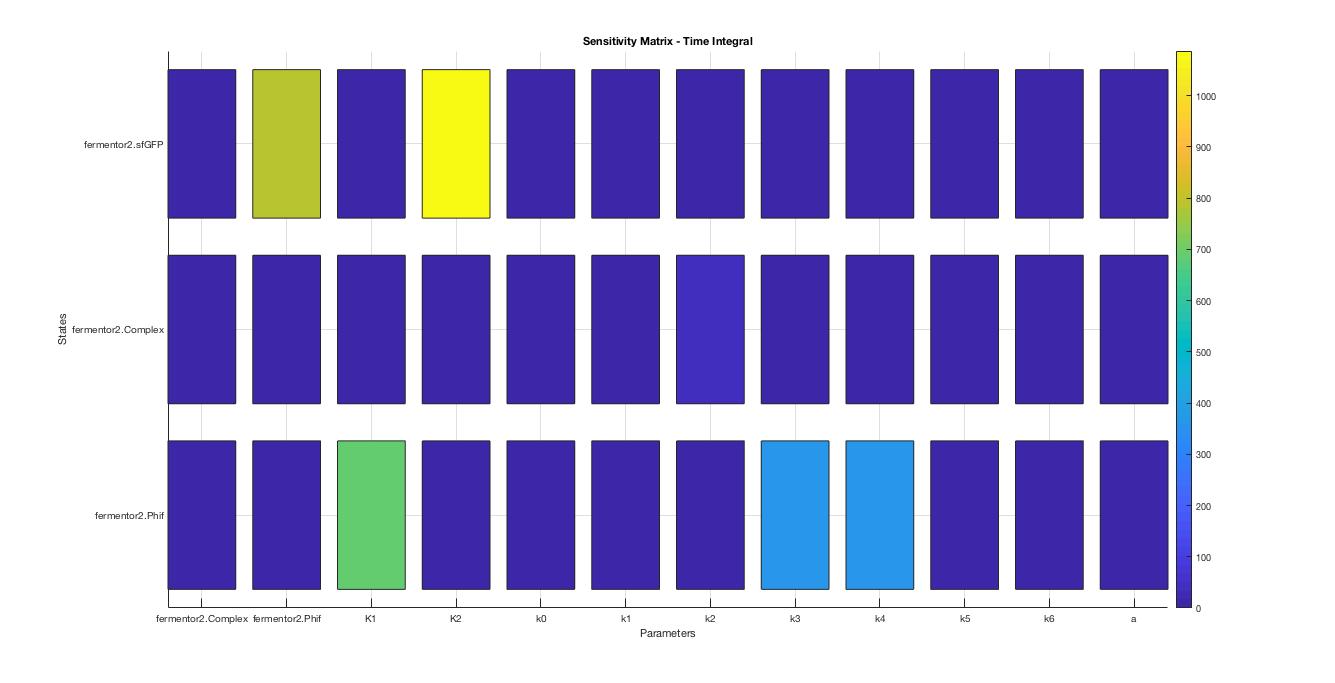
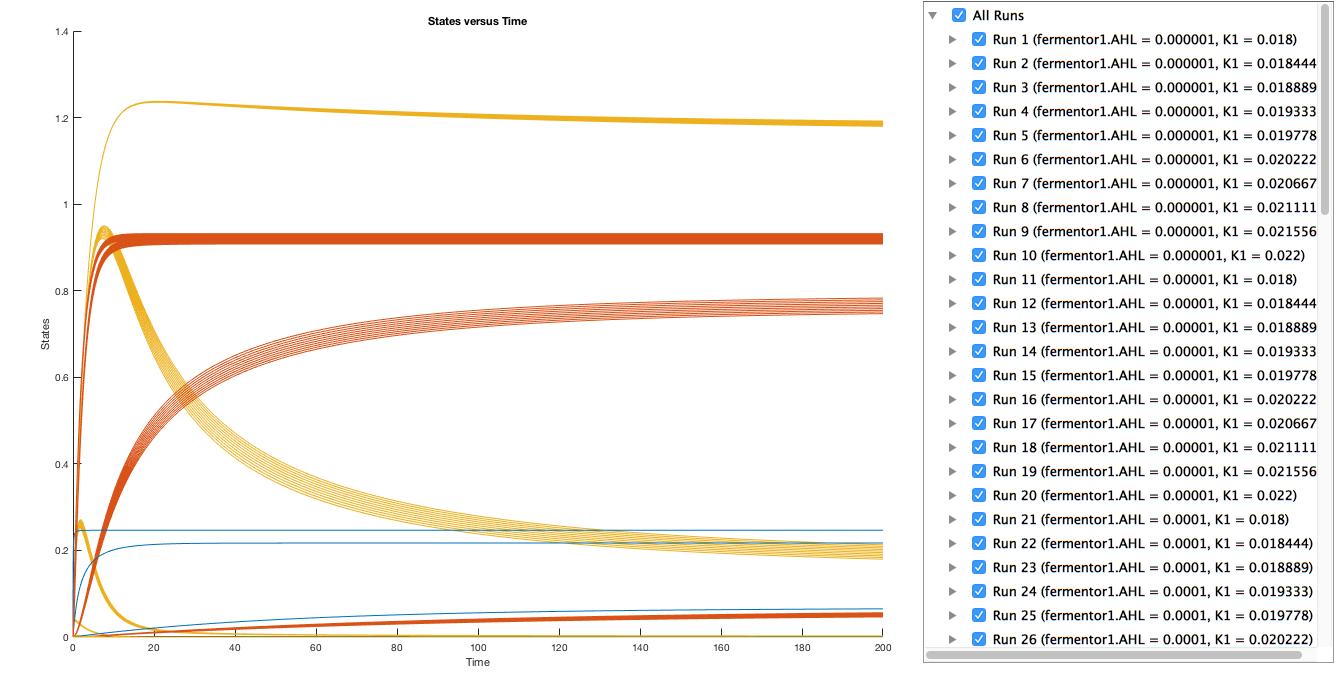
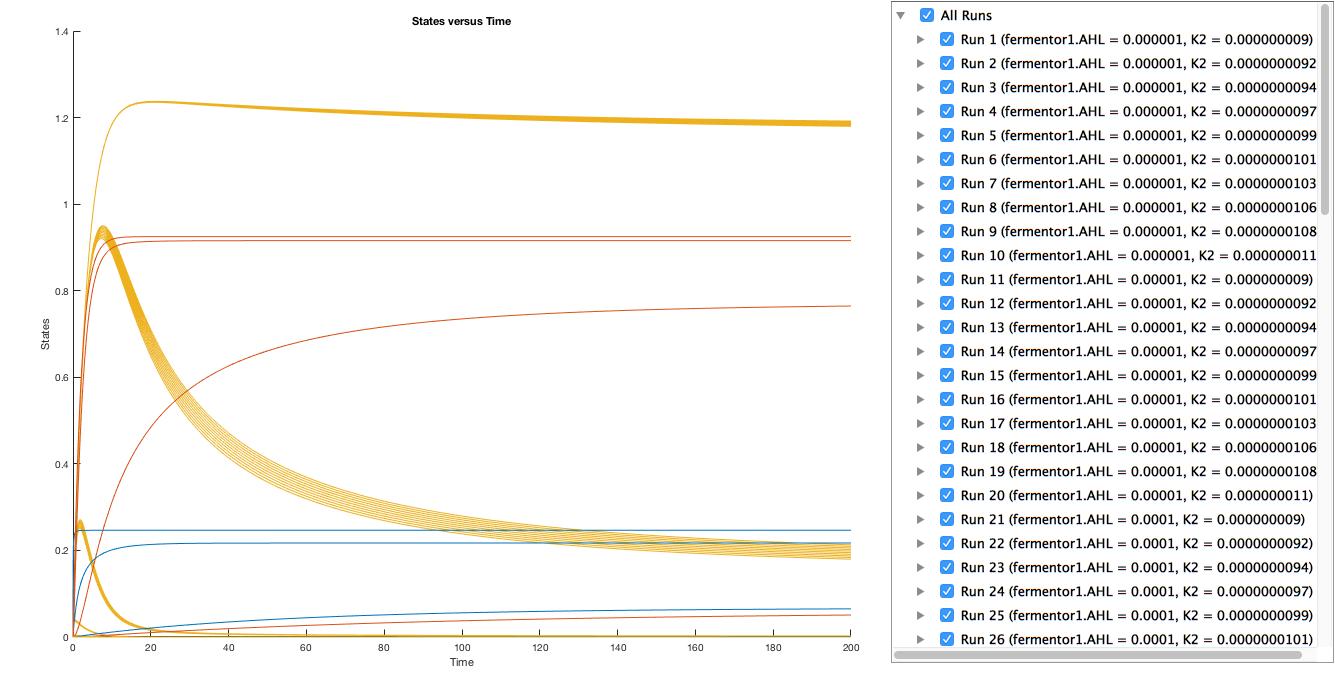
The scanning results suggest that the variation of the parameter, K1 and K2, by 10% respectively will not affect the trend.
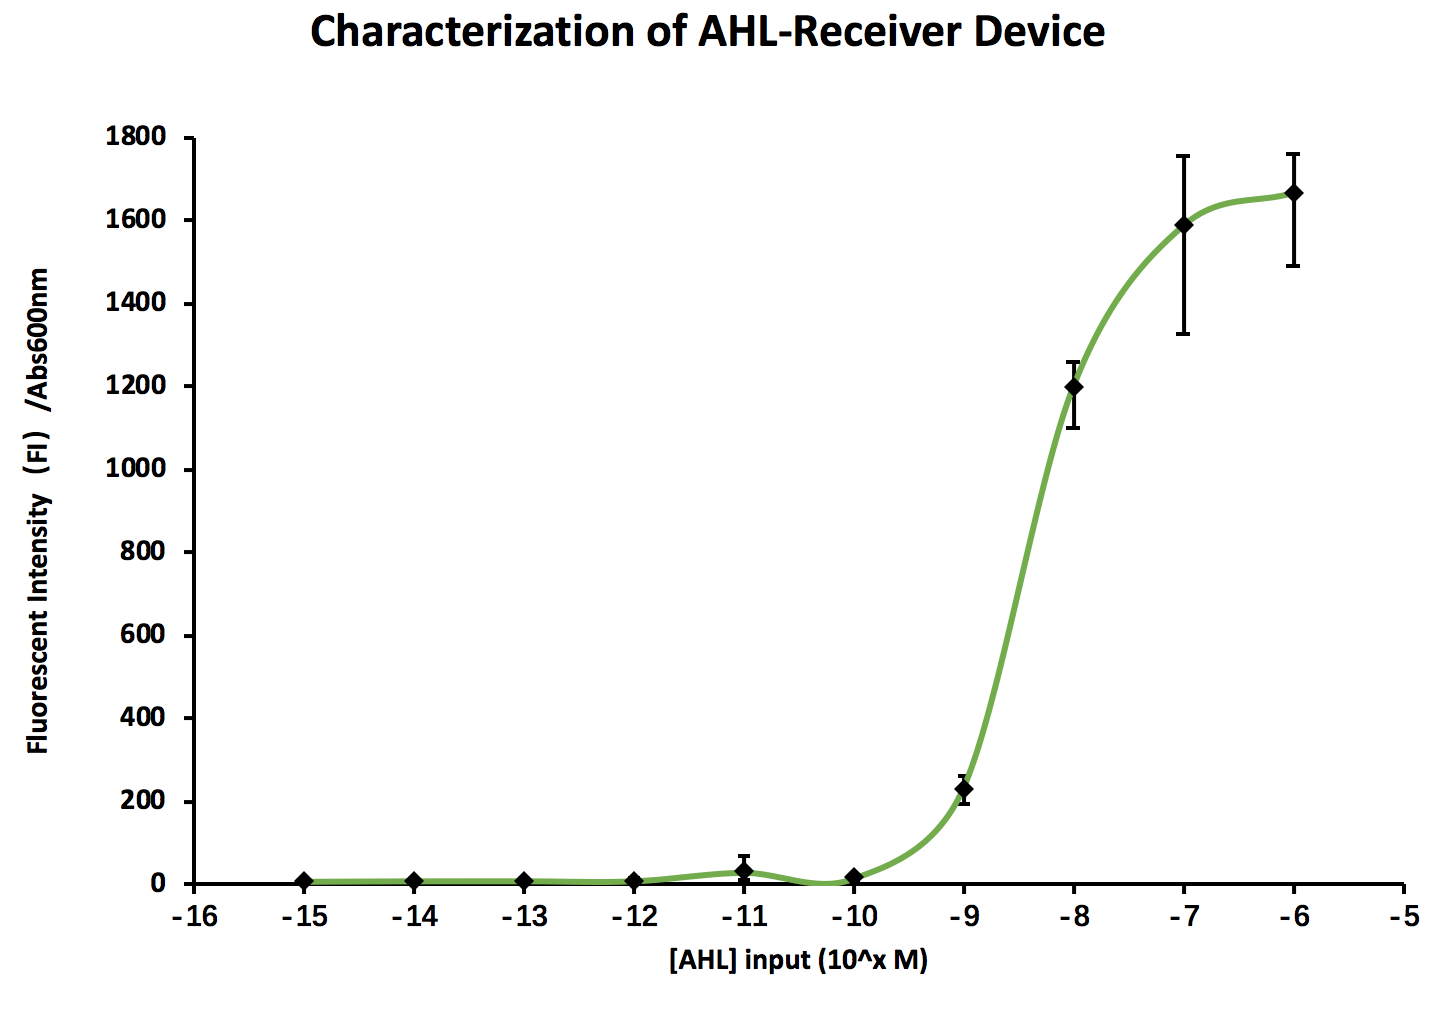
Furthermore, our results from the wetlab indicates a similar trend, corroborating our results from modelling
Discussion
In a real factory, there will be two fermentors, one for the production of AHL which helps keeping the bacteria in the second fermentor alive, one for the production of the main product. Theoretically, by measuring the OD in the first fermentor, the concentration of AHL can be inferred by using an algorithm shown below.
In conclusion, our model sheds light on the amount of concentration of AHL in the fermentor that is necessary for keeping the bacteria alive. The model simulation results correspond well to the data obtained from the wet-lab experiment. In addition, we also attempt to derive an algorithm to help measure the AHL concentration in the other fermentor.
References
[1] Basu, S., Mehreja, R., Thiberge, S., Chen, M., & Weiss, R. (2004). Spatiotemporal control of gene expression with pulse-generating networks. Proceedings Of The National Academy Of Sciences, 101(17), 6355-6360. doi:10.1073/pnas.0307571101
[2] Ingalls, Brian P. Mathematical Modeling in Systems Biology: an Introduction. MIT Press, 2013.
[3]"Luxi - Acyl-Homoserine-Lactone Synthase - Aliivibrio Fischeri - Luxi Gene & Protein". 2018. Uniprot.Org. Accessed October 18 2018. https://www.uniprot.org/uniprot/P12747.
[4]Rodrigo, G., Carrera, J., Elena, S. F., & Jaramillo, A. (2010). Robust dynamical pattern formation from a multifunctional minimal genetic circuit. BMC systems biology, 4(1), 48.
[5] Smith, R., Tan, C., Srimani, J., Pai, A., Riccione, K., Song, H., & You, L. (2014). Programmed Allee effect in bacteria causes a tradeoff between population spread and survival. Proceedings Of The National Academy Of Sciences, 111(5), 1969-1974. doi:10.1073/pnas.1315954111