Team:ZJUT-China/Model
Team:ZJUT-China
Abstract
In order to improve the feasibility of our system utilized by other researchers , we have tried our best to develop a model to predict the time point when the all antibiotic resistance genes(ARGs) are cut off and the cell auto-lysis is going to begin. This model is made up of some rate equations which are based on experimental data of our system. Then we are able to simulate the operation of our system and gain the information we need from the analog results.
System modeling Ver1.0
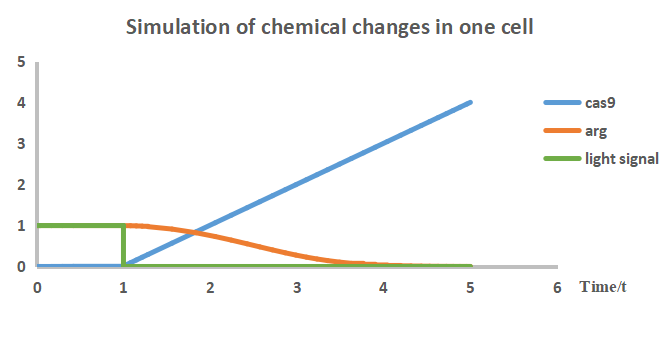
For the purpose of calculating the time point when the all ARGs are cut off and the cell auto-lysis is going to begin,we have tried to construct a model used by the following equations.
[Cas9]: The relative number of Cas9 protein
[vector]: The relative copy number of the vector
[light signal]: The relative light strength
[ARG]: The relative number of ARGs
[sg]: The relative number of sgRNA
Result
The result that we gain from the system modeling ver1.0 is shown below.
System modeling Ver1.1
Our system modeling ver1.0 is limited by problems that we are unable to verify the validity of the model through the experiments.Because the quantization of cas9 protein and ARGs is difficult.Therefore,we have tried to build up another model which is named as System modeling Ver1.1. This model can be used to predict the time point which is same as the System modeling Ver1.0 by growth curve. We are able to verify our model by experiments because the growth curve is easily gained by experiments.In addition,we can also prove the validity of system model ver1.0 for the reason that the equations of this model is based on the system model ver1.0.

[Cas9]: The relative number of Cas9 protein
[vector]: The relative copy number of the vector
[ara]: The concentration of arabinose used to induced expression
[ARG]: The relative number of ARGs
[sg]: The relative number of sgRNA
[cell]: The OD600 of viable cell

[cell-c]: The OD600 of viable cell
Result
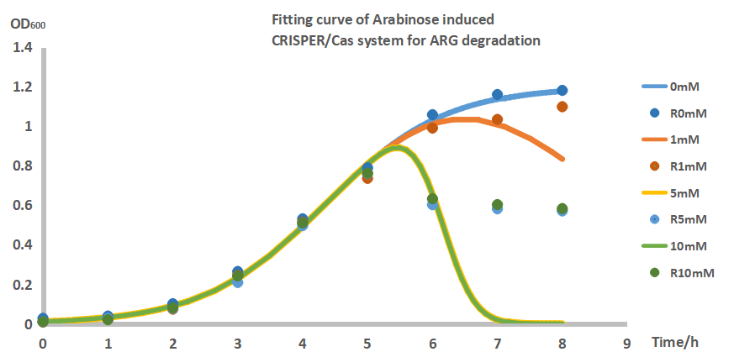
The points are the data get tested by wet lab and the lines are the data simulated by computer.
Our ODE model after fit data:

[Cas9]: The relative number of Cas9 protein
[vector]: The relative copy number of the vector
[ara]: The concentration of arabinose used to induced expression
[ARG]: The relative number of ARGs
[sg]: The relative number of sgRNA
[cell]: The OD600 of viable cell

[cell]: The OD600 of viable cell
By fitting the experimental data, we find that our system is feasible to predict the completion time of all the ARGs cleavage.Furthermore, we determine some constants based on experimental data which further improves our system and meets the requirements of the construction of the next model.
System modeling Ver2.0
However, if researchers would like to use our system in the complex environment,System modeling Ver1.1 can not meet their requirements. In order to address this issue, we have managed to develop a mathematical model considering the influence of light signal and some other factors.In other words,we regard the factors which include the influence of three repressors, sgRNA and lysin as parameters of system modeling ver2.0 .

[Repressor-1]: The relative number of the first Repressor protein we used in the system
[Repressor-2]: The relative number of the second Repressor protein we used in the system
[Repressor-3]: The relative number of the third Repressor protein we used in the system
[vector-1]: The relative copy number of the vector with the light-controlled promoter, repressor gene-2, cas9 gene, sgRNA gene-1, ARG-2, repressor gene-3 on it
[vector-2]: The relative copy number of the vector with ARG-1, repressor gene-2 on it
[chromosome]: The relative copy number of the chromosome
[Cas9]: The relative number of Cas9 protein
[sg-1]: The relative number of the first sgRNA
[sg-2]: The relative number of the second sgRNA
[ARG-1]: The relative number of the first ARG
[ARG-2]: The relative number of the second ARG
[lysin]: The relative number of the lysin protein
[cell]: The OD600 of viable cell
Through change the copy number of two vectors in our system model, we can get a ratio of the copy number let our system do nothing before we give the light signal, while has a faster react rate when we want it work.
Result
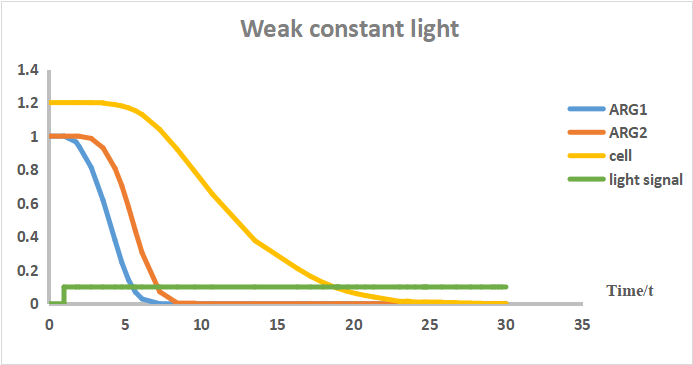
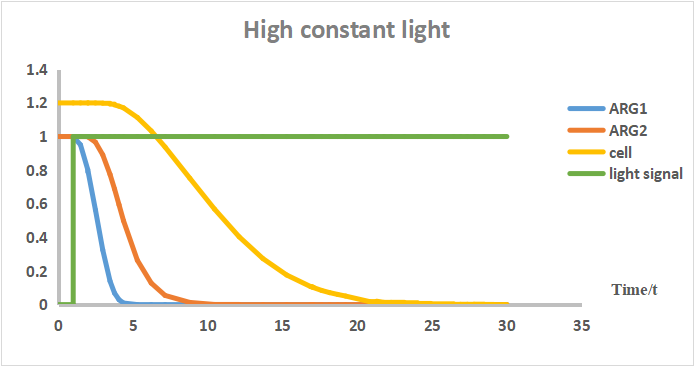
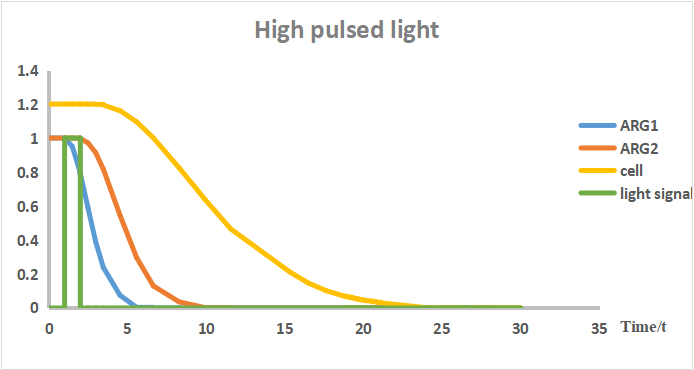
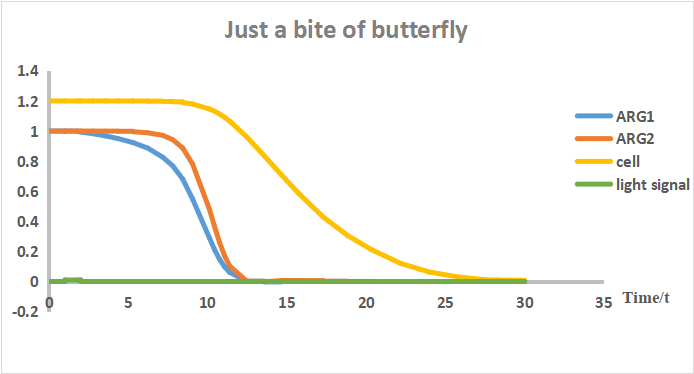
From the above results,we can clearly see that our system react faster under a very strength light signal.What’ more,we find that just a quite weak pulsed light signal is enough to start the operation of our system. According to this conclusion,our system is safe because the accidental leakage of bacteria will cut off all the ARGs and autolysis for the natural light.
Discussion
From the test of system modeling ver2.0, we find that the effect of giving a short pulsed light signal is almost same as a constant light signal.Therefore, we decide to give a short pulsed light signal for energy conservation.All in all, our modeling and analysis was focused to achieve a better theoretical grounding of forecasting how our system works after giving the light signal.
[2]Combinatorial transcriptional control of the lactose operon of Escherichia coli Thomas Kuhlman, Zhongge Zhang, Milton H. Saier, Jr., Terence Hwa Proc Natl Acad Sci U S A. 2007 Apr 3; 104(14): 6043–6048. Published online 2007 Mar 21. doi: 10.1073/pnas.0606717104


