Team:Montpellier/Tracking/Software

Introduction
To test the effect of our peptides and antibodies we needed a way to quantify the motility of spermatozoa. Ideally, we should be able to see the decreasing of sperm motility when in contact with our molecules or our bacteria secreting those molecules. For this, we developed a software that is able to track spermatozoa frame by frame. This software can give us the speed of each spermatozoon from a video and thus permits us a quantitative analysis of sperm motility. Our tracking tool is based on the “Trackpy” package that contains basic functions for tracking biological elements in sample.
All the functions that we are using are mentioned and described at the end of the page and the commented code is linked below. In this part, we are explaining the general principle and steps of our tracking software.
General steps to analyze the sperm motility
First of all, the video is recorded by the camera and saved in TIFF format (Figure 1).
The first goal of the tracking is to identify all the spermatozoa. This identification needs to be well balanced between sensibility and specificity . Trackpy is able to distinguish the spermatozoa and assign to each of them a position (x,y) for each frame. This is shown in figure 2 where the identified spermatozoa are contoured with a red circle. The choice of the parameters is given in the step-by-step description of the algorithm and in the tutorial.
Once all spermatozoa are detected, the software analyzes their positions frame by frame and provides as an output the trajectory of each spermatozoa (figure 3). This is a tricky step in which the algorithm needs to link the objects identified in one frame to the following frame and hence get the position (x,y) of each red circle as a function of time. However, trackpy sometimes “loses” the spermatozoa for some frames (and one spermatozoon could then generate two or more trajectories creating biases in the measurements), or two spermatozoa could come very close to each other during the length of the video (and their trajectories might mix up). We optimised the parameters of the method provided by the trackpy package in order to avoid these biases. Still, we manually checked all the videos analysed and corrected by hand the trajectories that were not accurate. To solve punctual errors, we correctly linked misbehaving objects frame to frame. The final results can be observed in the video below. We successfully identify trajectories that allow us to extract information on the motility of the spermatozoa.
The trajectories enable us to calculate the velocities of each spermatozoa. We first computed the instantaneous velocity of the spermatozoa along their trajectories, and then we smoothed the velocity with a linear filter (running average). We then calculated the mean velocity and the median velocity of each trajectory.
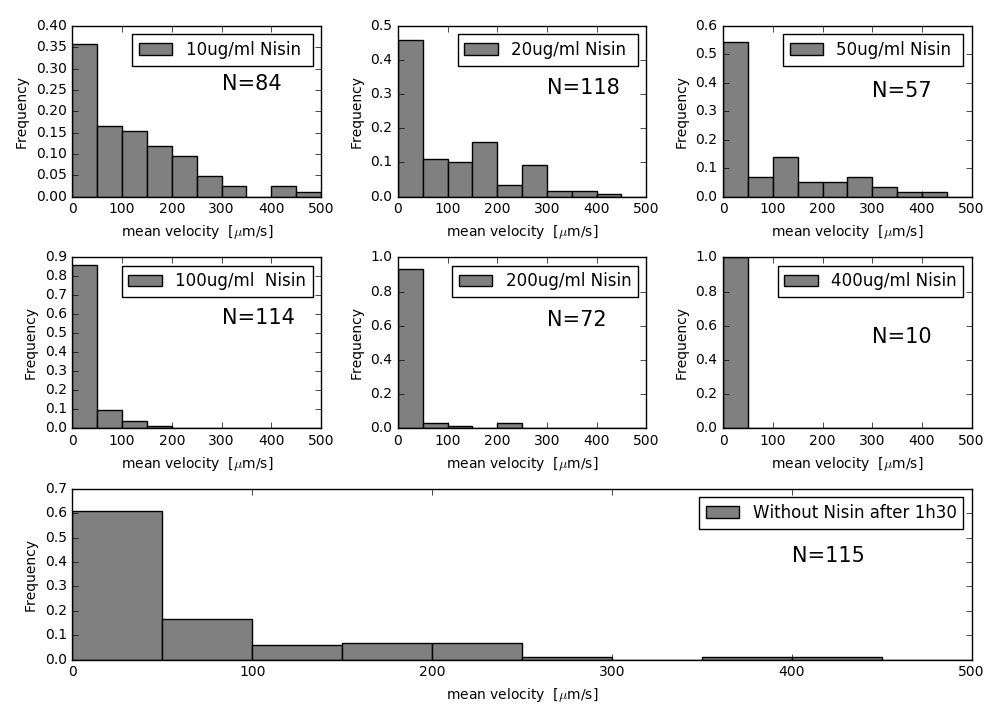
We then repeated the procedure for many videos in different conditions. More in particular, we tested the effect of different concentrations of nisin which is supposed to have a strong effect on the motility of spermatozoa. We also measured the velocity of spermatozoa without nisin.
We finally obtained histograms representing the distribution of the velocity of spermatozoa for each condition (Figure 4).
The functions used in the script
We start using the tp.locate function and put the good parameter that fit the circle to the object that has an average diameter:
- We detect for each frame spermatozoa by using the tp.batch function and we link each frame with another and annotate the same particle at each frame.
- We filter the data that we get by using tp.filter to keep only the spermatozoa that we detect only for 60FPs.
- We make other filtration as the filter by intensity to keep only the spermatozoa that have an intensity high specific mass.
- We add another filtration that it’s done manually in case the previous filtration doesn’t succeed to delete as the noise of background. Also, we combine the trajectory manually for the same spermatozoa.
- We add to the script line of code to make a video with trajectory. To see the efficiency of the tracking.
- We use the function tp.compute_drift to delete the drift case by the flux of the medium.
- We add to the DataFrame other columns that transform from pixel x and y position, to Um and final we calculate the velocity. To have more flexibility to use the data for each Spermatozoa we transform the DataFrame to Nestedictionary that contain dictionary and each dictionary contain dx, dy, and velocity for spermatozoa.
- We calculate the velocity by using the medium filter to make a uniform speed for each spermatozoa, we plot the velocity. And we calculate the medium velocity for each spermatozoa.
- Finally, we plot the histogram with the percentage.
Explanation of the script line by line
Here you can find the script and its explanation line by line : tutorial.