Glycolic Acid Production in E. coli
Abstract
Our aim was to produce glycolic acid for the production of biodegradable polymers. Hence, we overexpressed the genes aceA (isocitrate lyase) and ycdW (glyoxylate reductase) in Escherichia coli (E. coli) to synthesized glycolic acid from the TCA cycle intermediate isocitrate. In the end we successfully characterized our enzymes and verified the production of glycolic acid through both, NADPH and phenylhydrazine-dependent assays, as well as HPLC analysis. We therefore created a pair of BioBricks allowing the community to produce glycolic acid, and submitted them to the iGEM Registry (BBa_K2770003 & BBa_K2770002).
Introduction
Escherichia coli is the most frequently used and a well-established host organism for biotechnological applications. Especially its stable expression system of heterologous genes, fast growth rates and its overall well characterized metabolome and proteome make it a currently indispensable organism in biotechnology.
In our project, we modified the glyoxylate cycle of E. coli to produce glycolic acid. For this purpose, we overexpressed two native E. coli genes encoding the isocitrate lyase AceA and the glyoxylate reductase YcdW.
The isocitrate lyase catalyzes the conversion of isocitrate into glyoxylate and succinate. [1]. AceA has a tetrameric structure with a molecular mass of 47.522 kDa. (paper aceA)
Bild Enzym aceA File:T--TU Darmstadt--AceA.mp4 Figure 1: Tetrameric structure of the isocitrate lyase (AceA) with a molecular mass of 47.522 kDa.
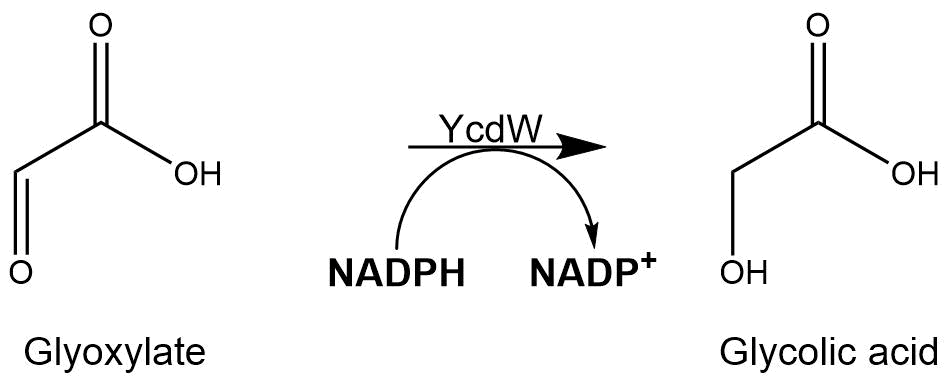
Subsequently, the glyoxylate produced by the isocitrate lyase AceA is further converted into glycolic acid by the NADPH-dependent glyoxylate reductase YcdW. It has molecular weight of 35.343 kDa.
Figure 2: Structure of the NADPH-dependent glyoxylate reductase (YcdW) with a molecular mass of 35.343 kDa.
Through overexpression of both key enzymes, we achieved the heterologous production of glycolic acid in E. coli. We assess our accomplishment as a crucial step towards a more environment-friendly production of biodegradable polymers.
Figure 3: Reaction mechanism of AceA and YcdW
Methods
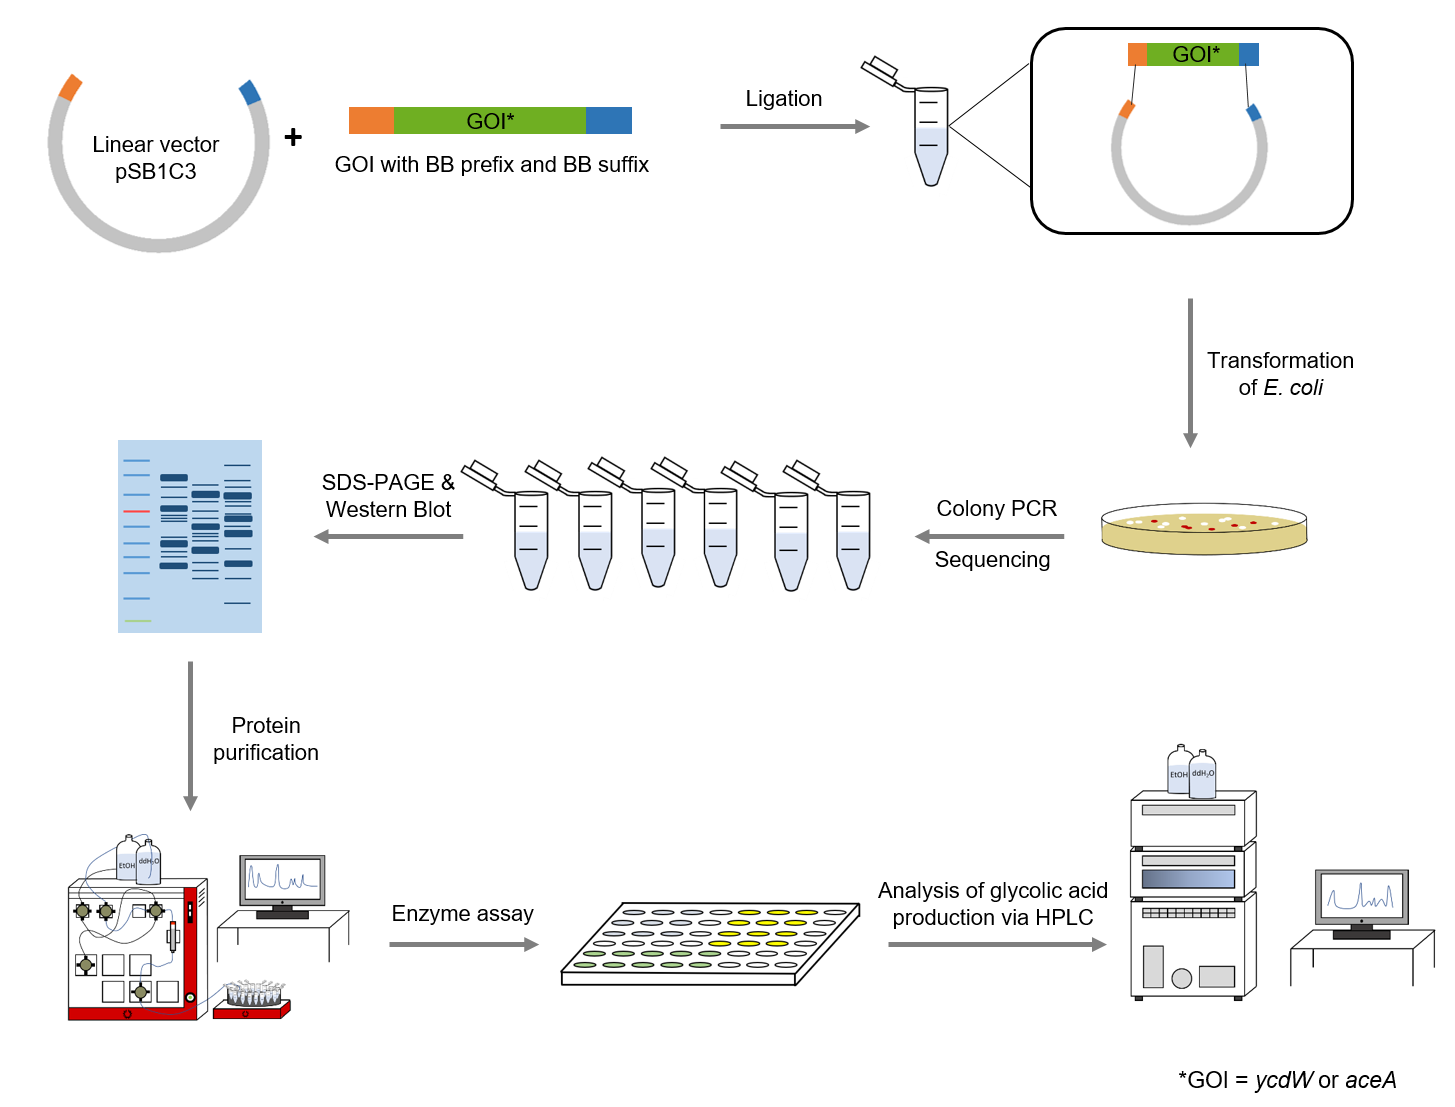
Figure 4: Schematic representation of work flow.
Cloning
The sequences for aceA and ycdW were modified with a His-tag, ordered from Integrated DNA Technologies (IDT) and inserted into the pSB1C3 plasmid. For this purpose, the BioBrick assembly (BBa) was used. A T7 lac promotor (BBa_K921000) and a B0034-based ribosomal binding site (BBa_K2380024) were inserted upstream of the coding sequence via the BBa as well. E. coli TOP10 were transformed with generated plasmids and positive colonies were identified via colony PCR and DNA sequencing.
Figure 5: pSB1C3 plasmid including expression cassette of aceA
Figure 6: pSB1C3 plasmid including expression cassette of ycdW
SDS-PAGE and Western Blot
To verify that aceA and ycdW were expressed and the corresponding proteins were translated, a SDS-PAGE and Western Blot were performed. The resulting bands were compared to the expected protein sizes of AceA and YcdW.
Purification
After expression of AceA and YcdW in E. coli BL21 by induction of the T7 lac promotor with IPTG, an ÄKTA chromatography system (GE Healthcare, Illinois, USA) was used to purify the desired His-tagged enzymes.
Enzyme assays
The purified enzymes were spectrophotometrically assayed for their activity using a plate reader. For the assay of the isocitrat lyase (AceA), the enzyme activity was tested via a phenylhydrazine-dependent reaction. As soon as AceA converts isocitrate into glyoxylate, the product reacts with phenylhydrazin to glyoxylate-phenylhydrazone, which possesses an absorption maximum at 324 nm. The change in absorption at 324 nm was measured over time. A calibration curve was created to calculate the glyoxylate-phenylhydrazone conversion rate. Therefore, the absorption of different concentrations of glyoxylate and phenylhyrazine was used.
Figure 7: Reaction mechanism of phenylhydrazine-dependent assay for the verification of AceA enzyme activity
The assay for the glyoxylate reductase YcdW is based on the different absorption maxima of NADPH (absorption maximum at 340 nm) and NADP (maximum at 260 nm). During the reaction the enzyme uses NADPH as a cofactor. NADPH is converted into NADP which leads to a decrease of absorption at 340 nm. By measuring the absorption level at 340 nm over time, it is possible to quantify the enzyme activity and glycolic acid production. A calibration curve was created to calculate the NADPH conversion rate. Therefore, the absorption of different NADPH concentrations was measured.
Figure 8: Reaction mechanism of NADPH-dependent conversion of glyoxylate into glycolic acid performed by YcdW enzyme
HPLC analysis
To detect the precursors, as well as the produced monomer glycolic acid, high-performance liquid chromatography (HPLC) was employed. An organic acid separation column as stationary phase and sulfuric acid as mobile phase allowed the separation of isocitrate, glyoxylate and glycolic acid. Signals were recorded by a refractive index detector.
M9 growth assay
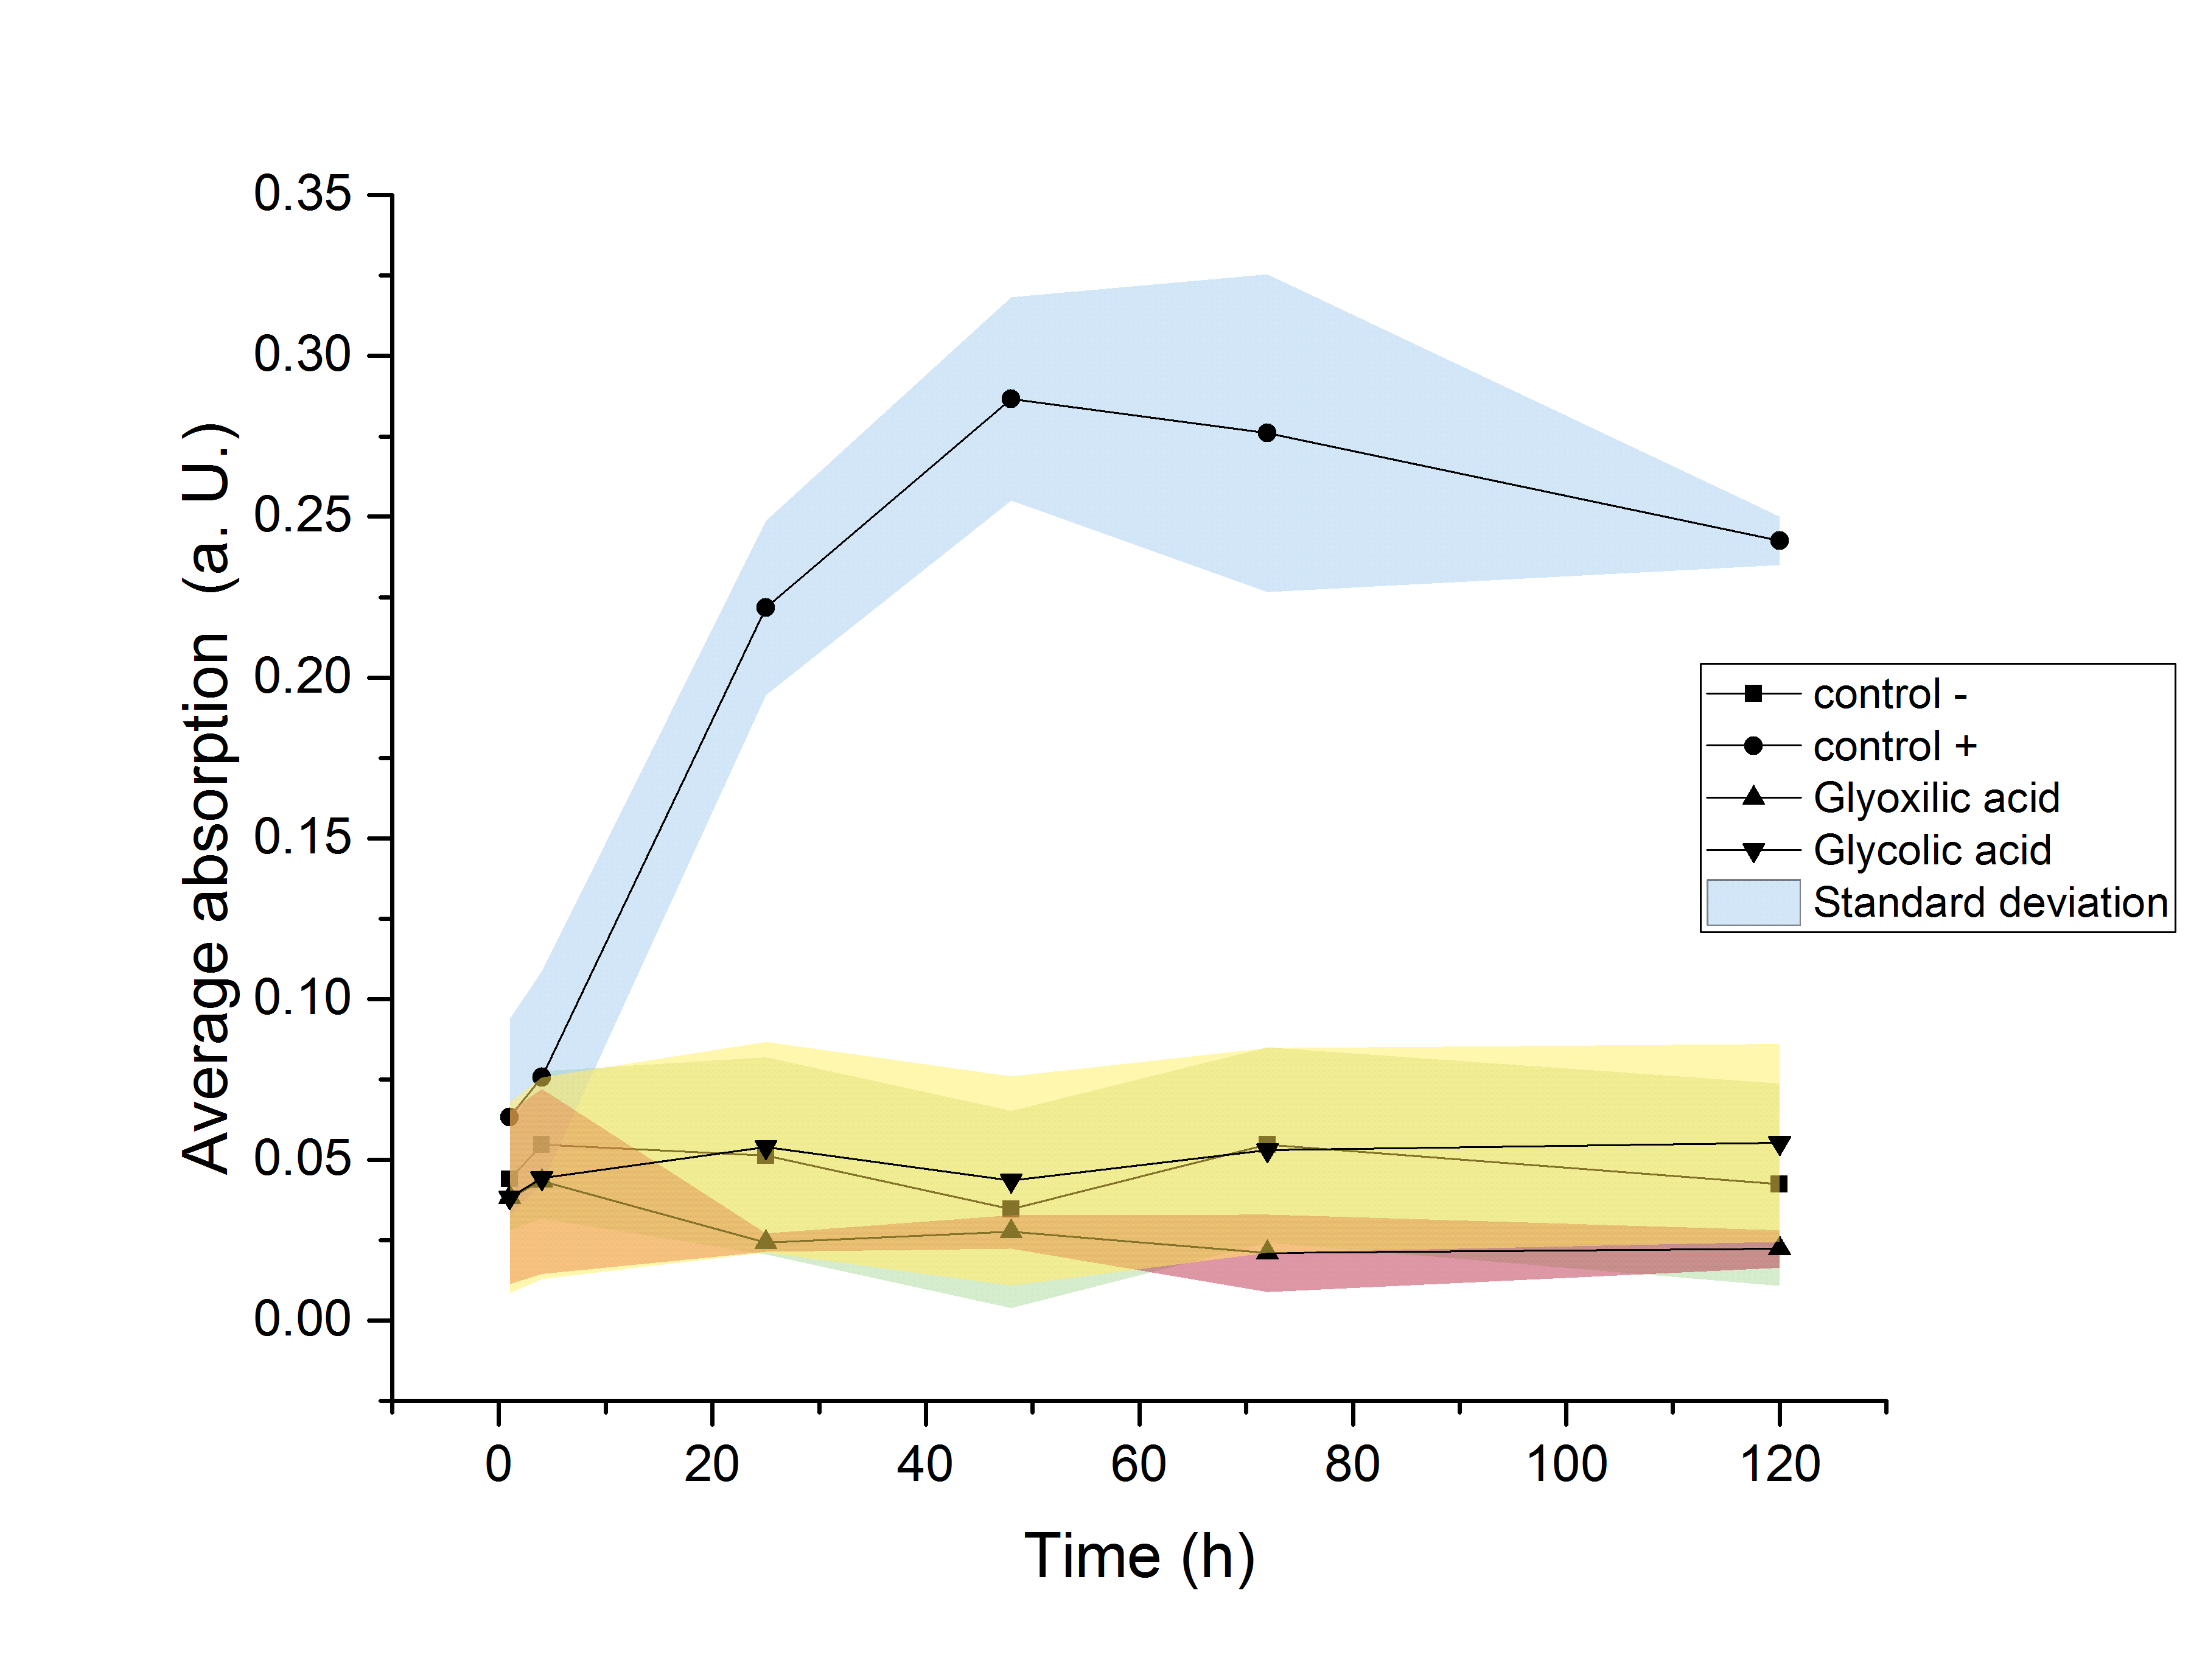
The growth of E. coli BL21 transformed with an YcdW-generating plasmid was studied in M9 minimal media with and without a supplemented carbon source. M9 minimal medium consists of numerous salts to achieve an isotonic environment, but no carbon source. Hence, bacterial growth in M9 minimal media is inhibited. However, by supplementing either glucose, glyoxylate or glycolic acid in M9 media, the potential metabolization of these compounds of interest as a carbon source can be investigated. Therefore, the OD600 of E. coli cultures with the different carbon sources of interest were measured over a period of four days and compared to a carbon source-deficient culture.
Results and Discussion
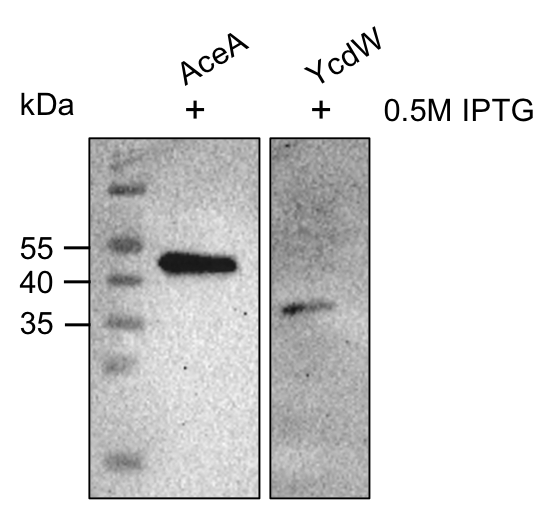
The aceA and the ycdW genes were cloned in E. coli TOP 10. Furthermore, the plasmids were successfully transformed into BL21 cell lines to enable protein production under the control of an IPTG inducible T7-lac promotor (BBA_K921000). An attached His-tag was used to purify the encoded enzymes via an ÄKTA system. The subsequent SDS-PAGE showed bands of the expected protein sizes. We also proved the successful production and purification of the enzymes via Western blot (see figure 9). The expected sizes were 47.52 kDa for AceA and 34.34 kDa for YcdW, respective bands could be detected on the Western blot.
Figure 9: Western blot analysis of purified proteins AceA & YcdW. Thermo Scientific PageRuler Prestained Protein Ladder was used. The nitrocellulose membrane was incubated with an anti-His antibody. For protein detection, a mouse anti-rabbit antibody conjugated with a horseradish-peroxidase was used.
As seen in figure 9, the proteins AceA and YcdW show the expected signals. This indicates their successful purification and production in E. coli. Hence, we started the protein characterization via in vitro enzyme assays.
AceA enzyme assay
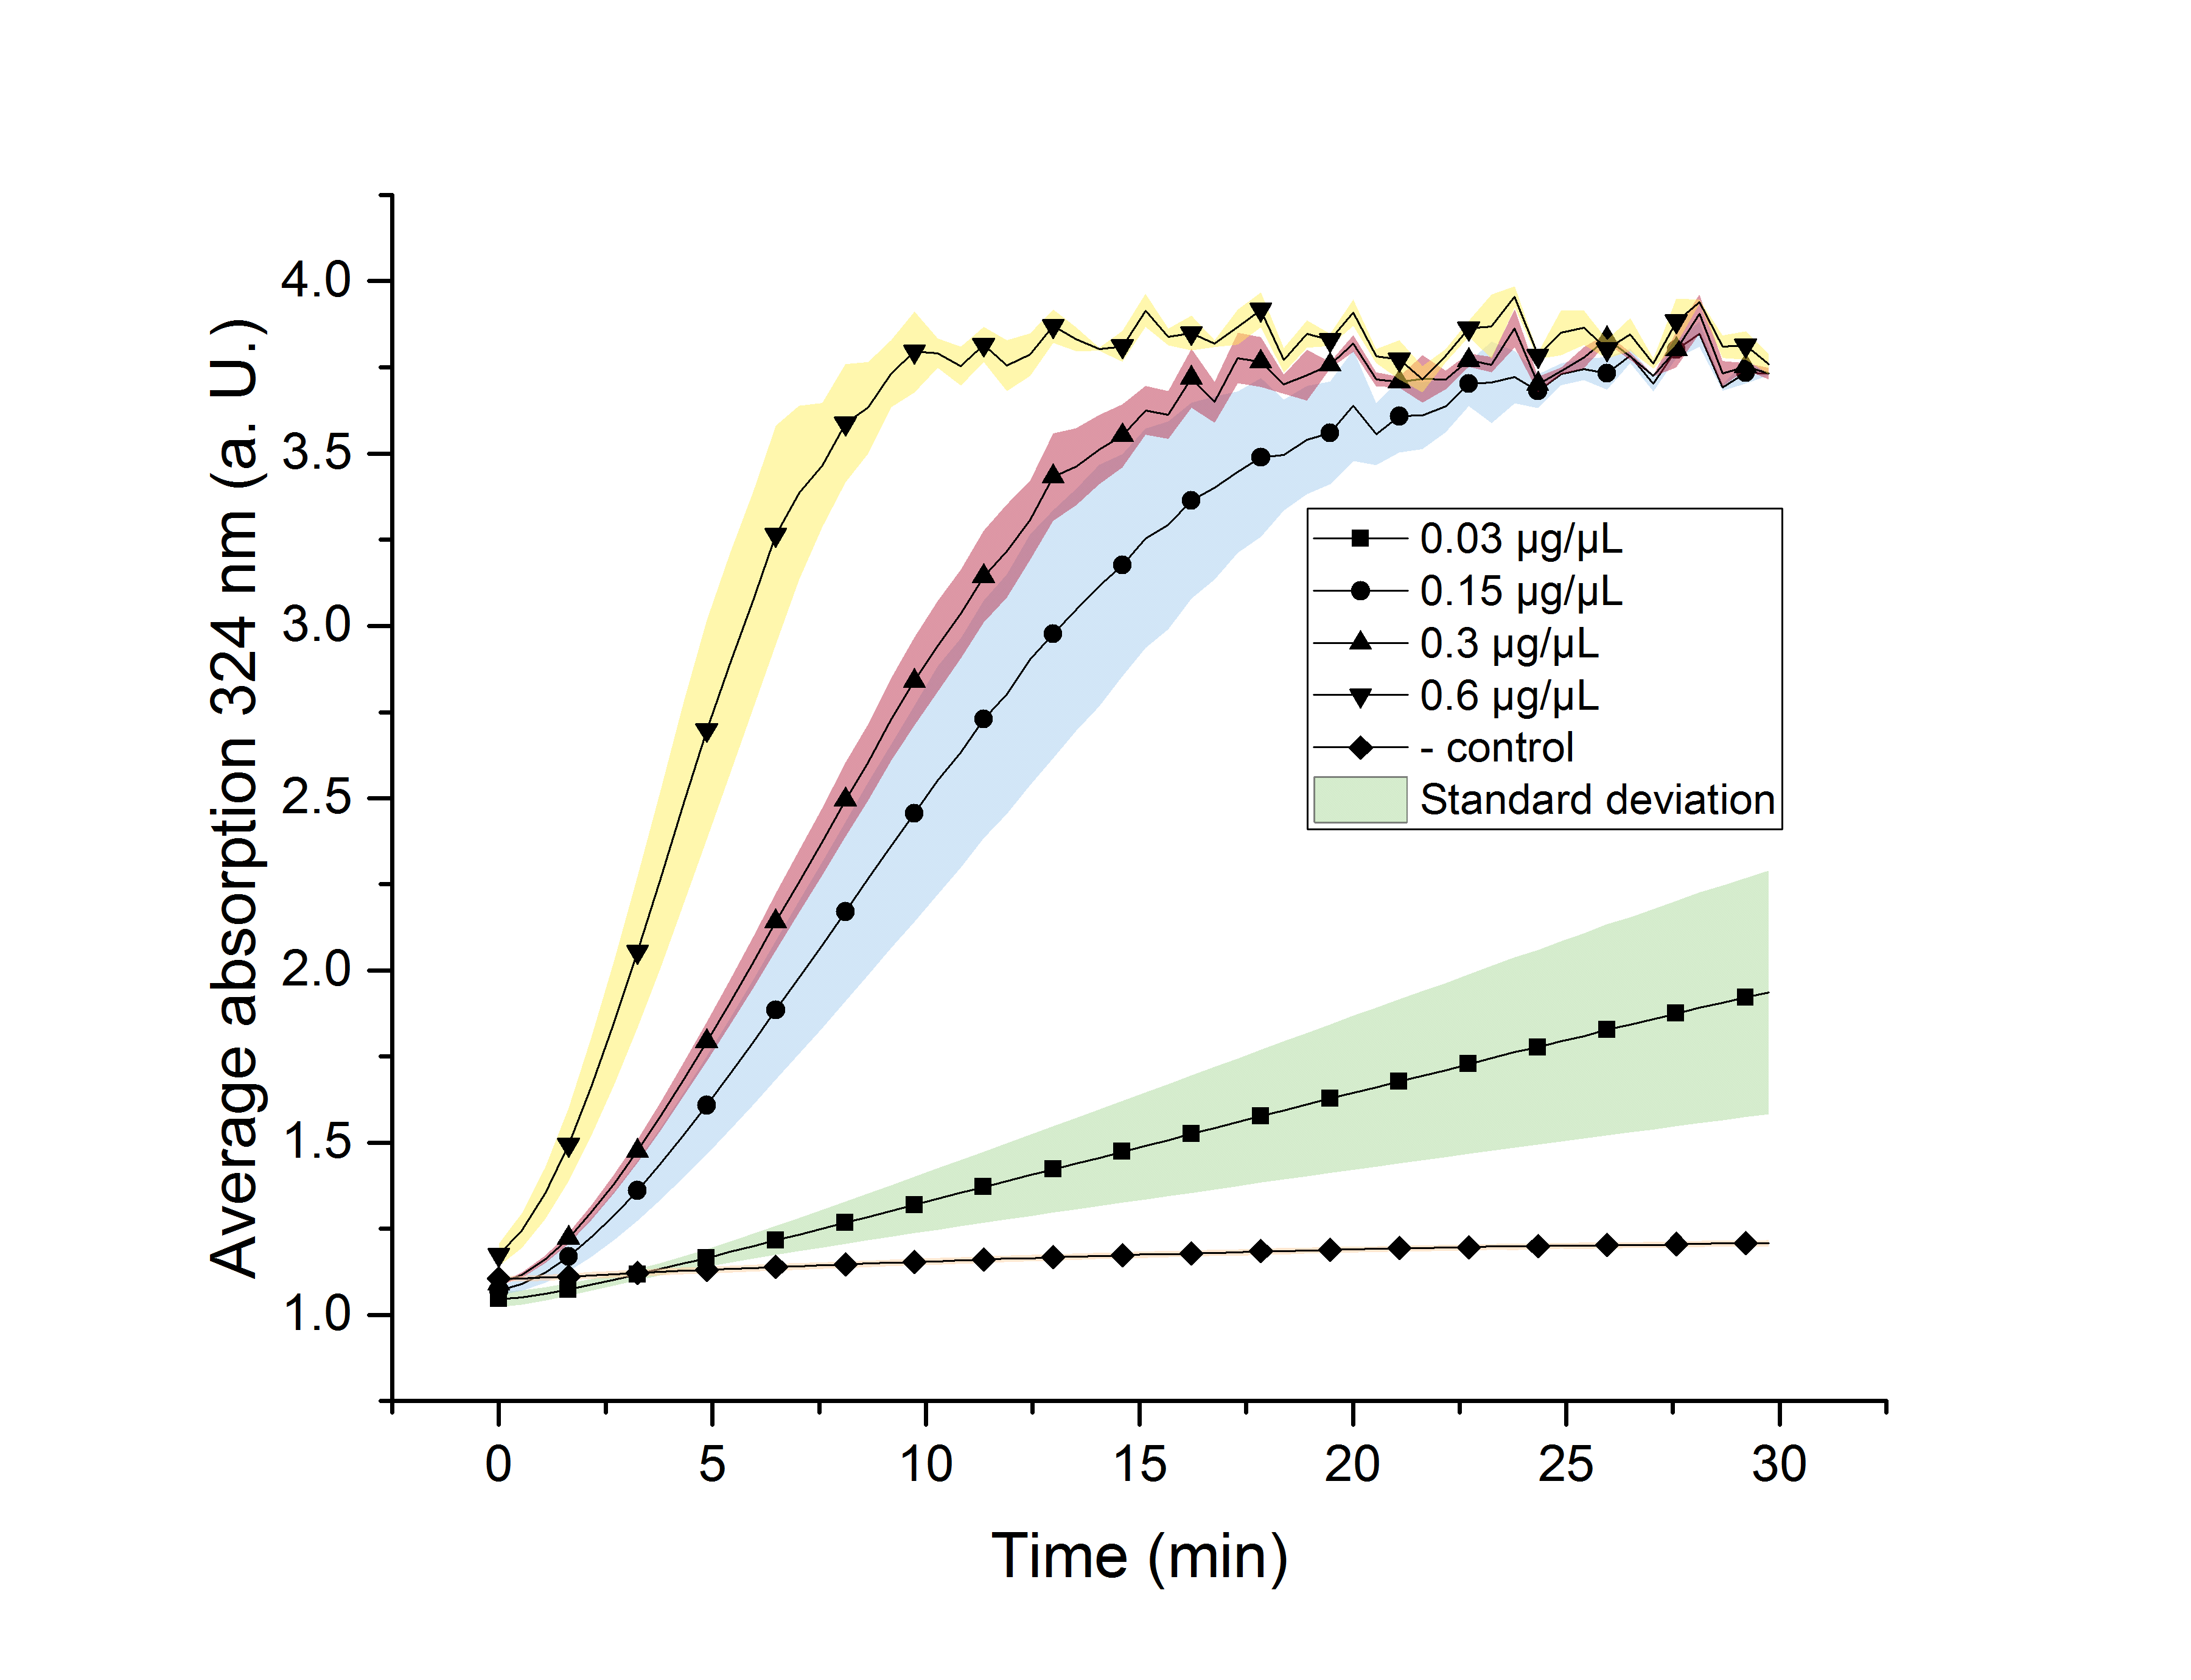
We verified the enzyme activity of AceA via a phenylhydrazine-dependent assay with the collected protein fractions from the ÄKTA purification. By adding phenylhydrazine to the reaction, glyoxylate produced during the reaction (reaction time of 30 minutes) will further react to glyoxylate-phenylhydrazone which absorbs light at a wavelength of 324 nm. Hence, we can indirectly measure glyoxylate production over time. During the experiment we also included a negative control without enzyme. We used different enzyme concentrations (0.03 µg/µl; 0.15 µg/µl; 0.3 µg/µl; 0.6 µg/µL) and temperatures (21 °C/25 °C/37 °C) to screen for the best conditions.
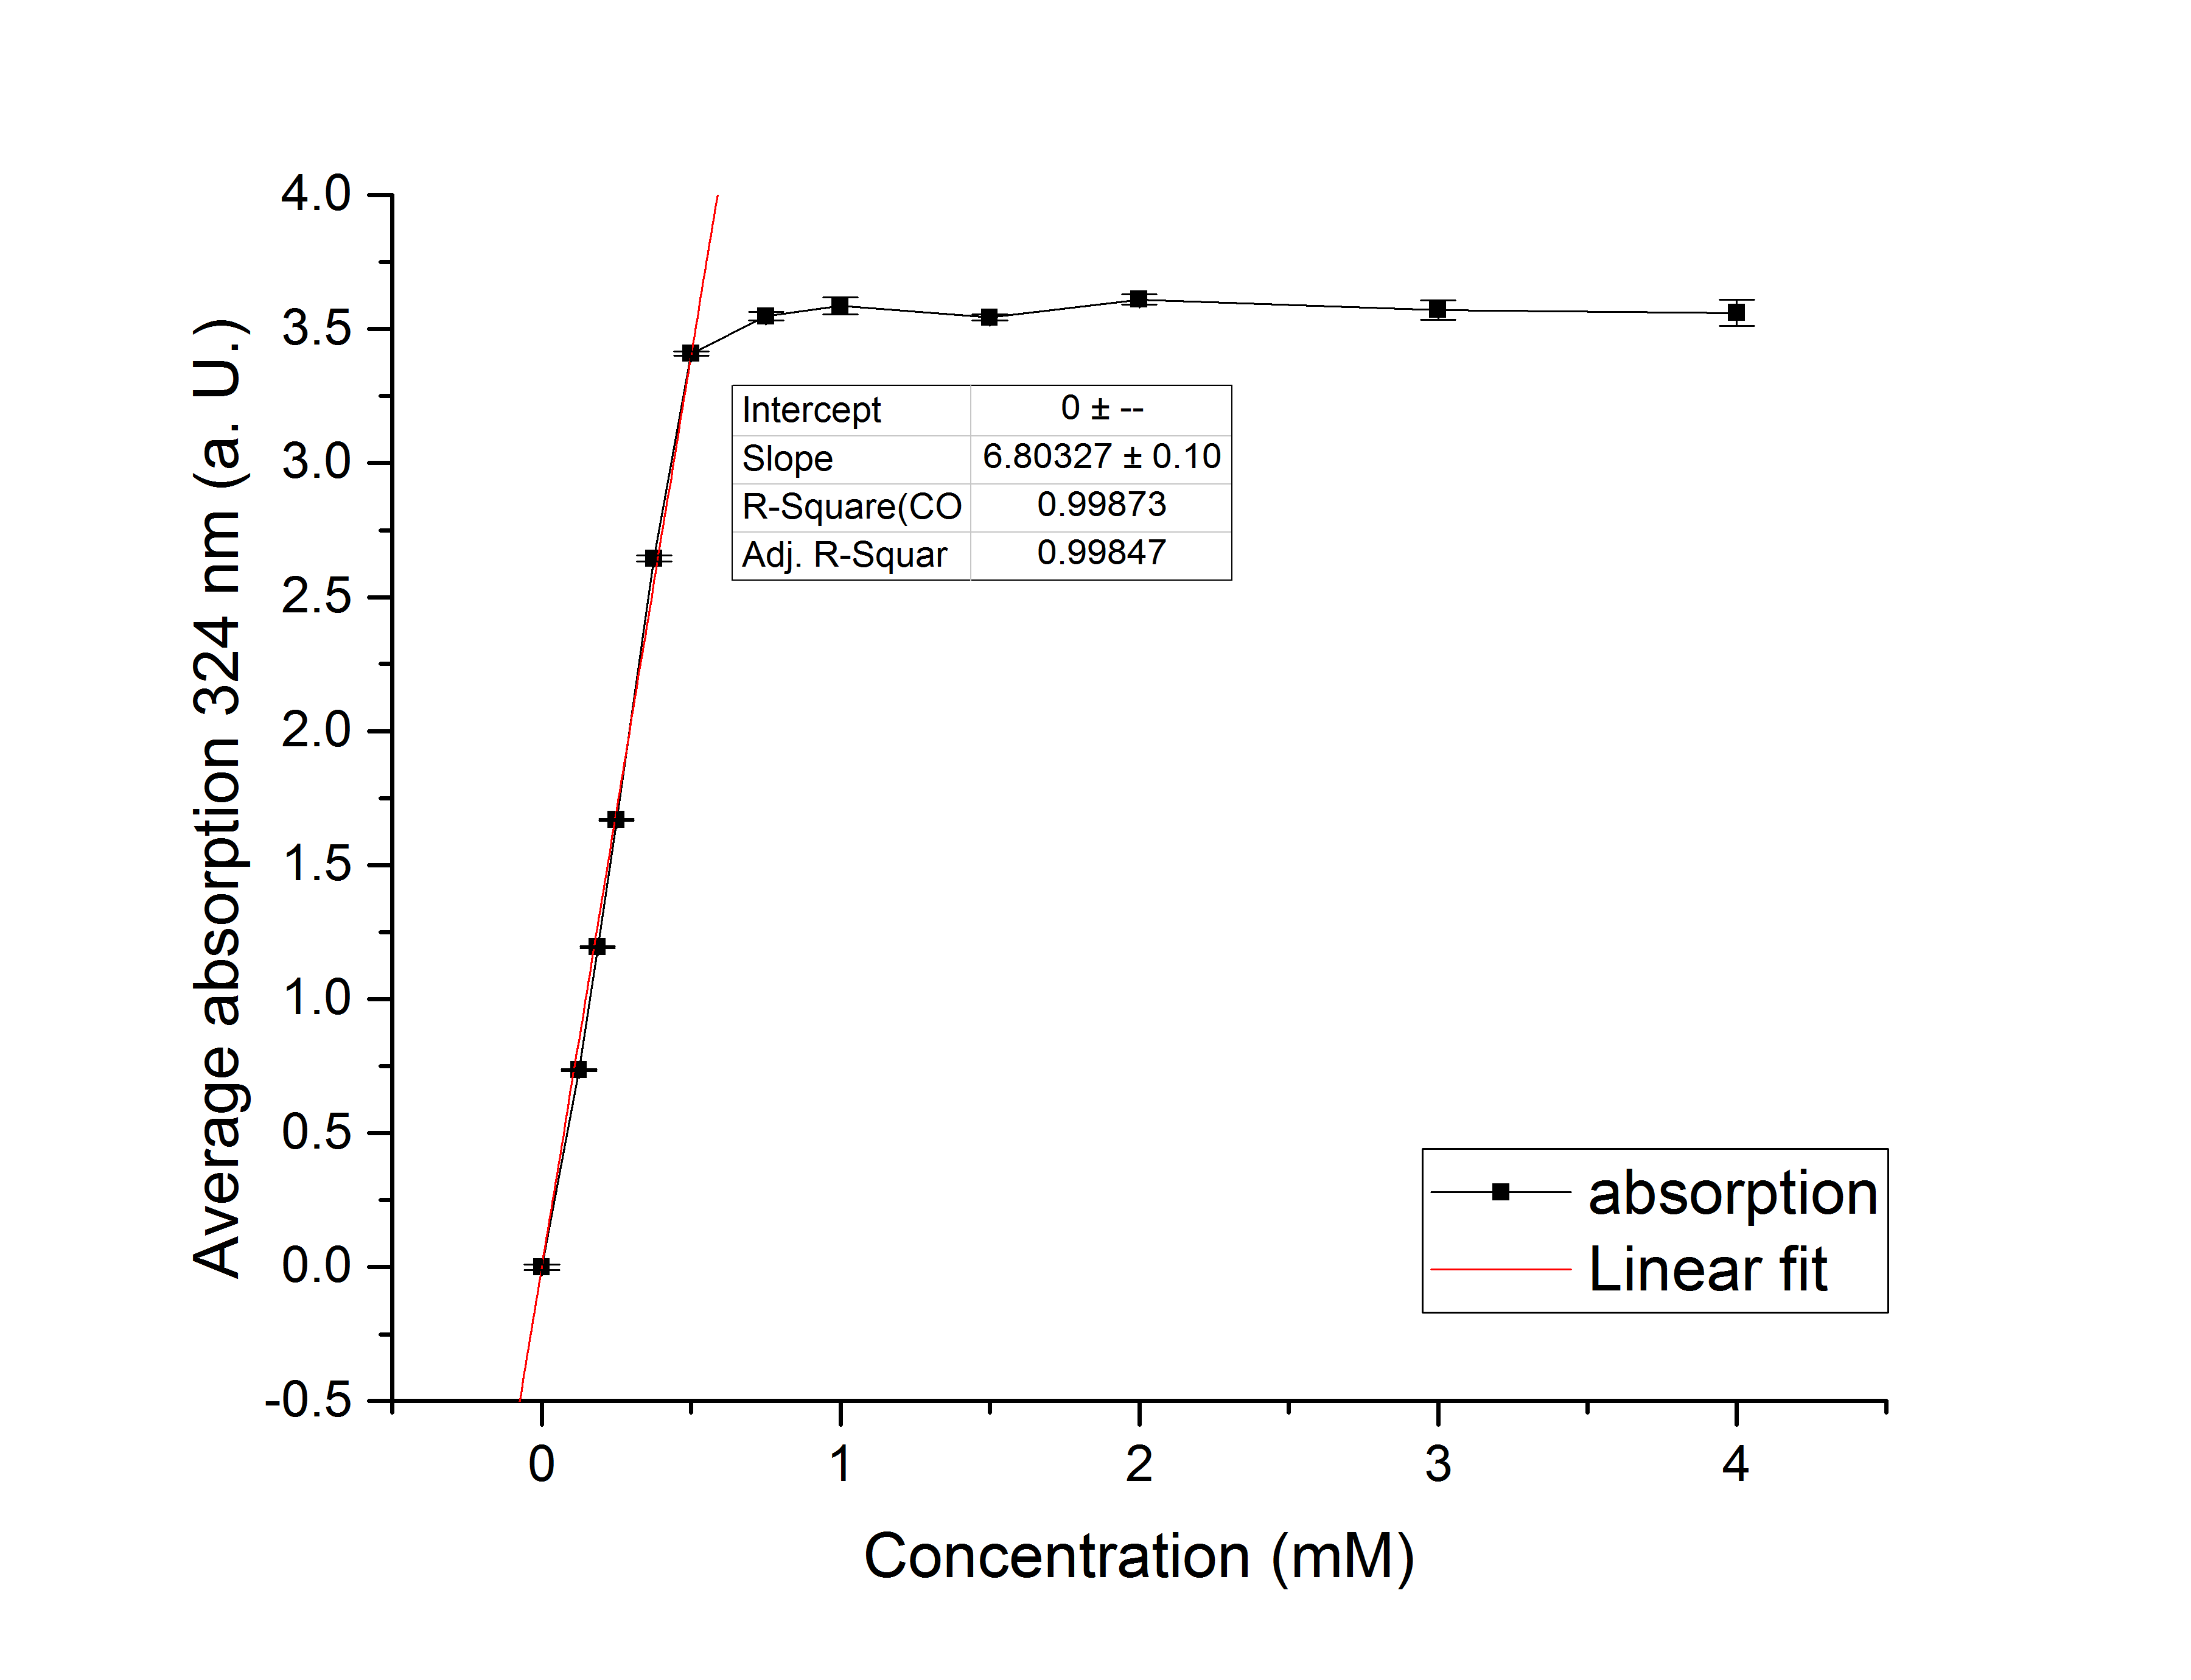
Referring to Robertson et al., (PAPER LINK), we first carried out assays with different enzyme concentrations at 25 °C (figure 11). Figure 10 shows the calibration curve for the AceA assay, which is used to calculate the substrate turnover per time. To create the calibration curve, the absorption of different glyoxylate-phenylhydrazone concentrations were measured and compared to the resulting assay absorptions (figure 11). For the AceA enzyme assay it was expected that a higher concentration would result in a faster substrate conversion.
Figure 10: Figure 3: Calibration curve for AceA enzyme assay with different glyoxylate concentrations (0 mM, 0.125 mM, 0.1875 mM, 0.25 mM, 0.375 mM, 0.5 mM, 0.75 mM, 1 mM, 1.5 mM, 2 mM, 3 mM and 4 mM).
Figure 11: AceA enzyme assay at 25°C and 324 nm. The graph shows the average absorption in correlation to the time (min). Reactions with different enzyme concentration were measured, as well as a negative control sample without enzyme.
All enzyme concentrations reach an absorption (324 nm) of approximate 3.7, but with different substrate conversion rates. Higher absorption values than 3.7 are not detectable by the plate reader. Hence, it is not possible to determine the exact rate of yield. The negative control stays on a constant absorption level, which indicates that the increase in absorption of the enzyme containing samples is based on enzymatic activity. As expected, figure 11 shows that a higher enzyme concentration leads to a faster turnover of glyoxylate. The highest concentration of 0.6 µg/µL results in a substrate conversion rate of 0.912 µM/s. Hence, we decided to carry out further analysis regarding the optimal temperature with an enzyme concentration of 0.6 µg/µL.
To study the enzyme activity at different temperatures we next performed the assay at 21 °C and 37 °C. The substrate conversion per time (µM/s) is shown in table 1. Therefore, the substrate conversion values were recorded in the linear range of the particular curve in a time frame of 3.5 minutes. It should be noted that the determination does not start at the exact same time for all samples, but the time frame of 3.5 minutes was retained. Three replicates were measured for every assay.
Table 1: Substrate conversion of AceA per time (µM/s) in correlation to different temperatures (21°C, 25°C and 37°C).
| Temperature [°C] | Substrate conversion
per second [µM/s] |
|---|---|
| 21 | 0.82 |
| 25 | 0.912 |
| 37 | 0.914 |
Table 1 shows that the enzyme performs best at a temperature of 37 °C and 25 °C with a substrate conversion of 0.914 µM/s and 0.912µM/s. At a temperature of 21 °C the enzyme shows its lowest conversion rate of 0.82 µM/s. Referring to Robertson et al., the 25 °C assay was used for further analysis.
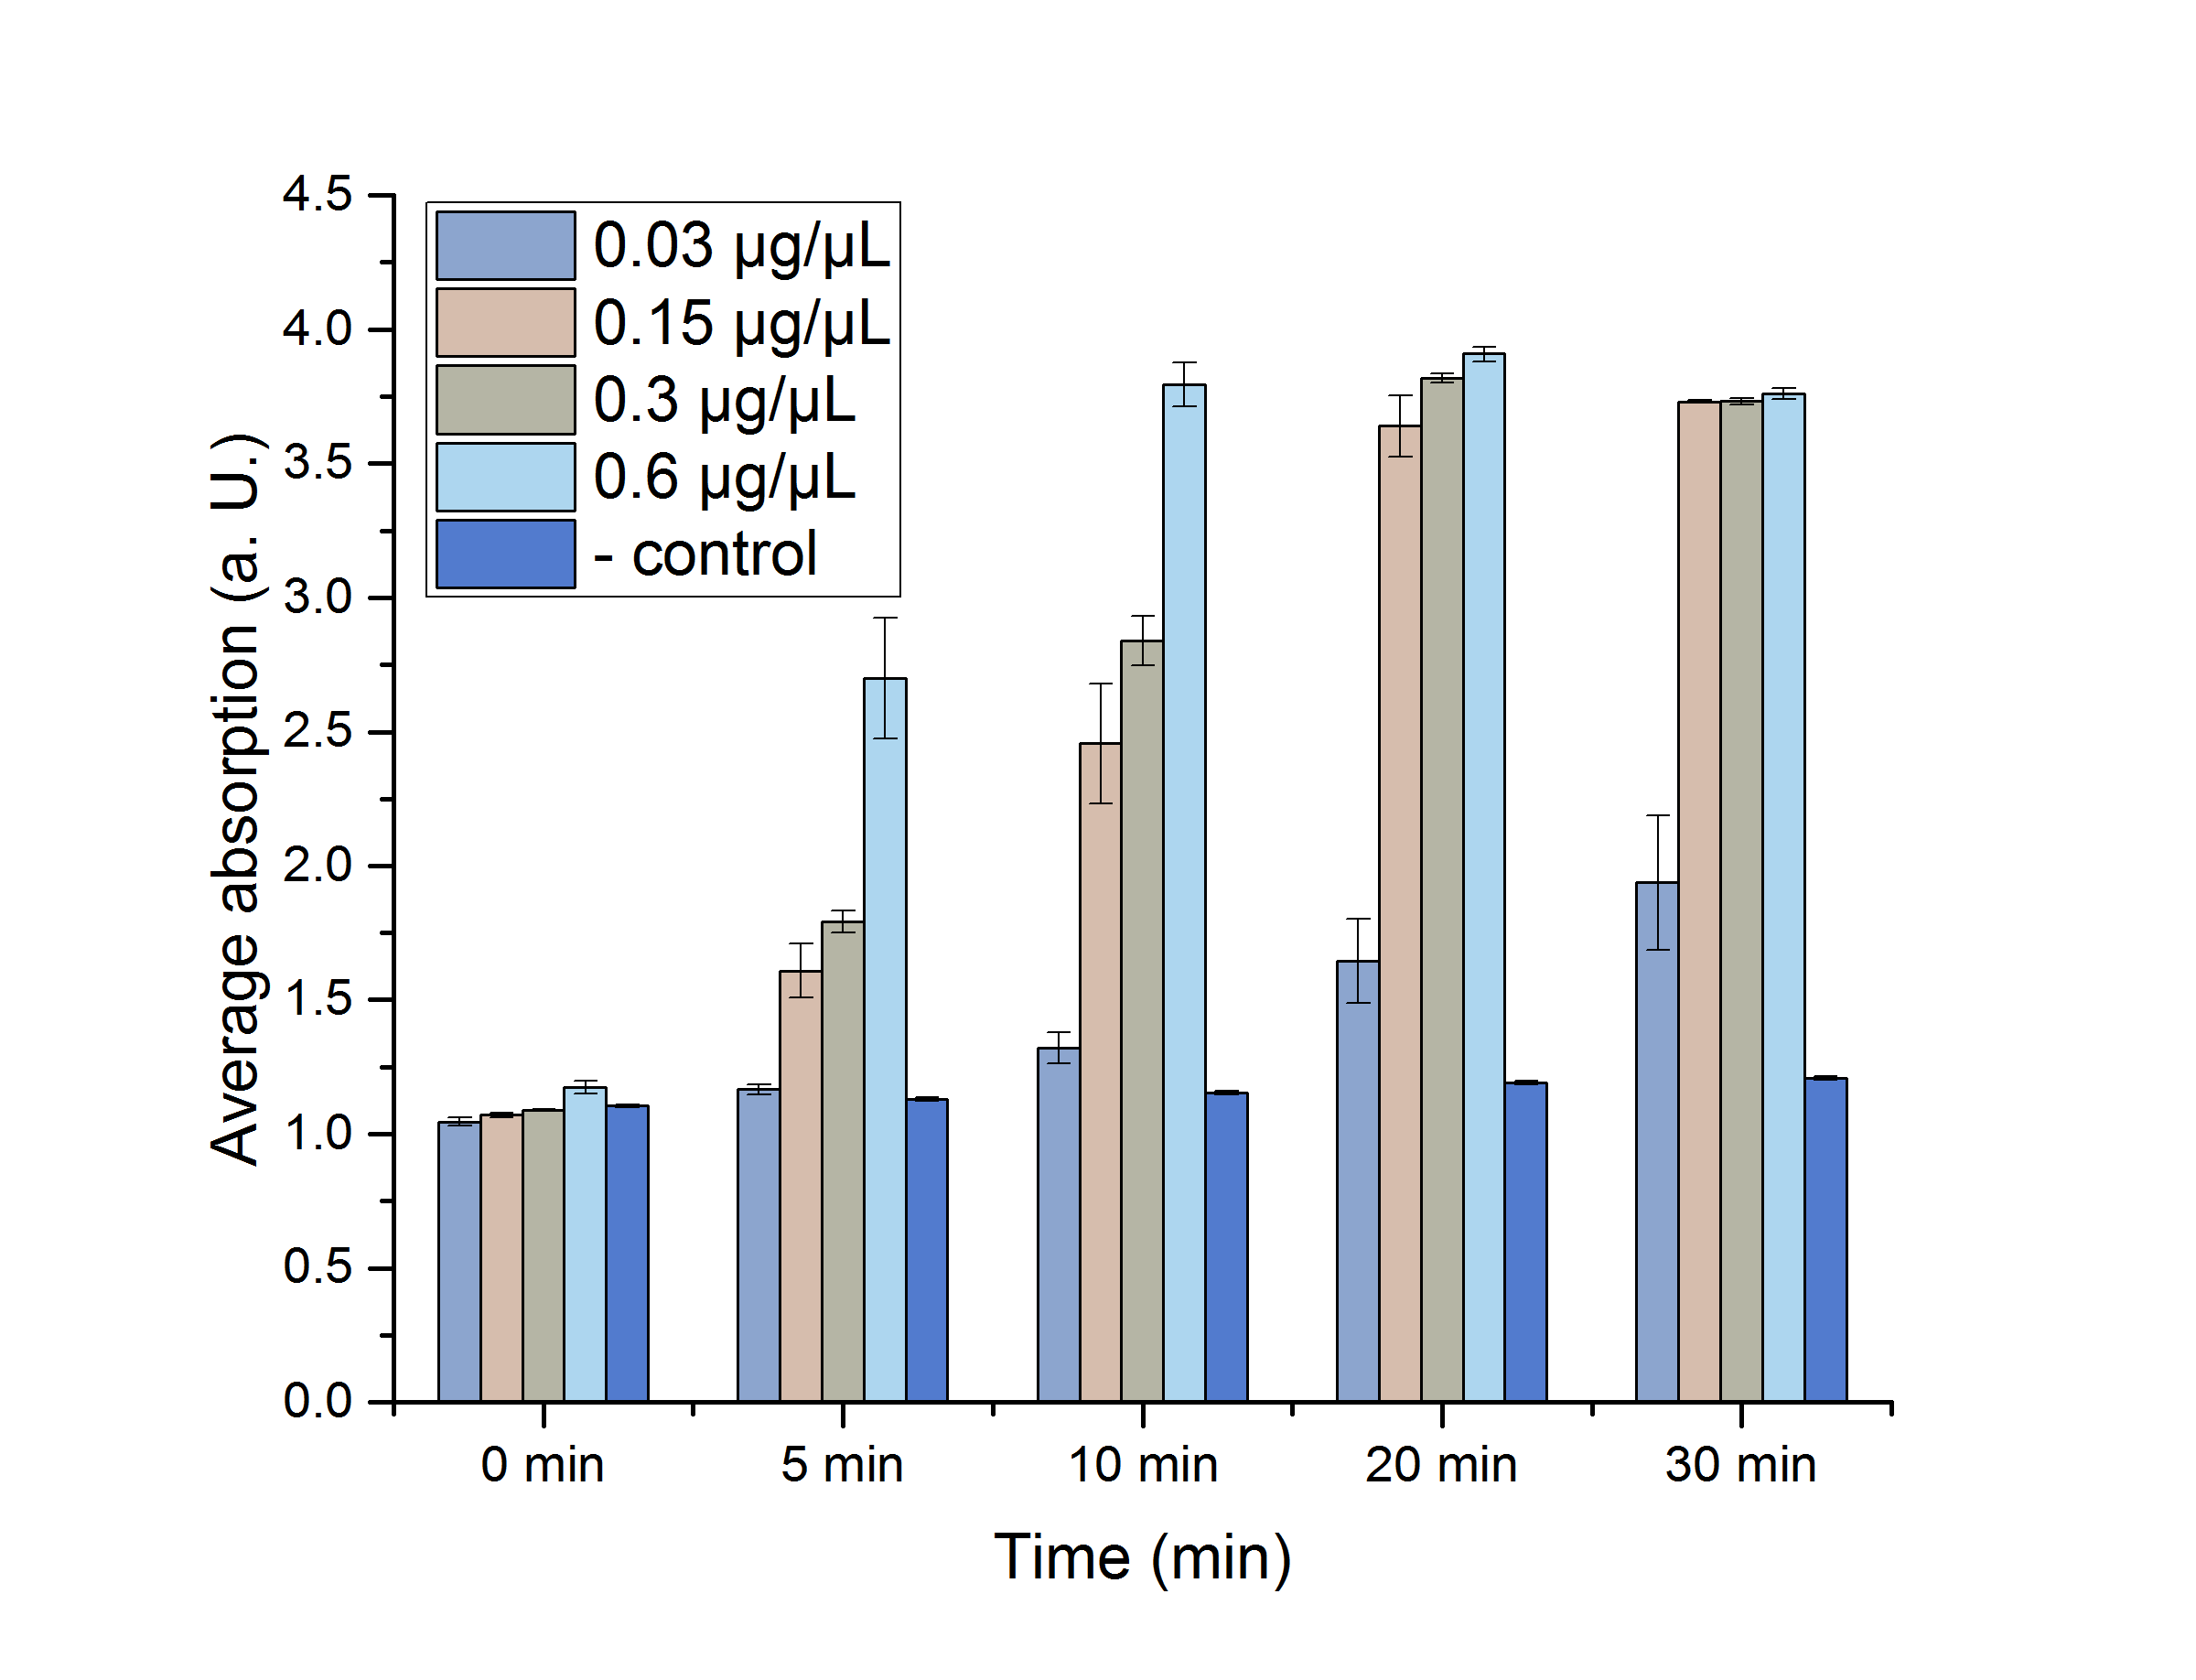
A Student's t-test was performed to check the significance of our data. For this test, five data points from the 25 °C assay were chosen (0, 5, 10, 20 and 30 minutes)(see table 2)
Table 2: Calculated significance of AceA data sets for 0, 5, 10, 20 and 30 minutes, 25 °C. The table also shows the absorption as well as the particular standard error. A= Absorption, *= Significance (p-value < 0.05), n= 3
| AceA [µg/µL] | A (t=0 min) | A (t=5 min) | A (t=10 min) | A (t=20 min) | A (t=30 min) |
|---|---|---|---|---|---|
| 0.03 | 1.046±0.016* | 1.665±0.018 | 1.32±0.058 | 1.645±0.258 | 1.937±0.249 |
| 0.15 | 1.071±0.009* | 1.609±0.1* | 2.456±0.222* | 3.639±0.114* | 3.732±0,003* |
| 0.3 | 1.089±0.003 | 1.793±0.04* | 2.84±0.091* | 3.19±0.017* | 3.732±0.012* |
| 0.6 | 1.175±0.023 | 2.698±0.225* | 3.795±0.083* | 3.909±0.027* | 3.759±0.02* |
| neg. | 1.105±0.005 | 1.13+0.007 | 1.154+0.007 | 1.191±0.006 | 1.209±0.006 |
As shown in table 2, most of the data points show a p-value < 0.05, which indicates that the data is significant. Non-significant p-values appear in the data set of the lowest enzyme concentration. For a better visualization, the data sets are plotted in figure 12.
Figure 12: Enzyme assay absorption for 0, 5, 10, 20 and 30 minutes with standard error. n=3
After the characterization of the in vitro enzyme activity, the production of glyoxylate was analyzed via High-performance liquid chromatography (HPLC).
YcdW enzyme assay
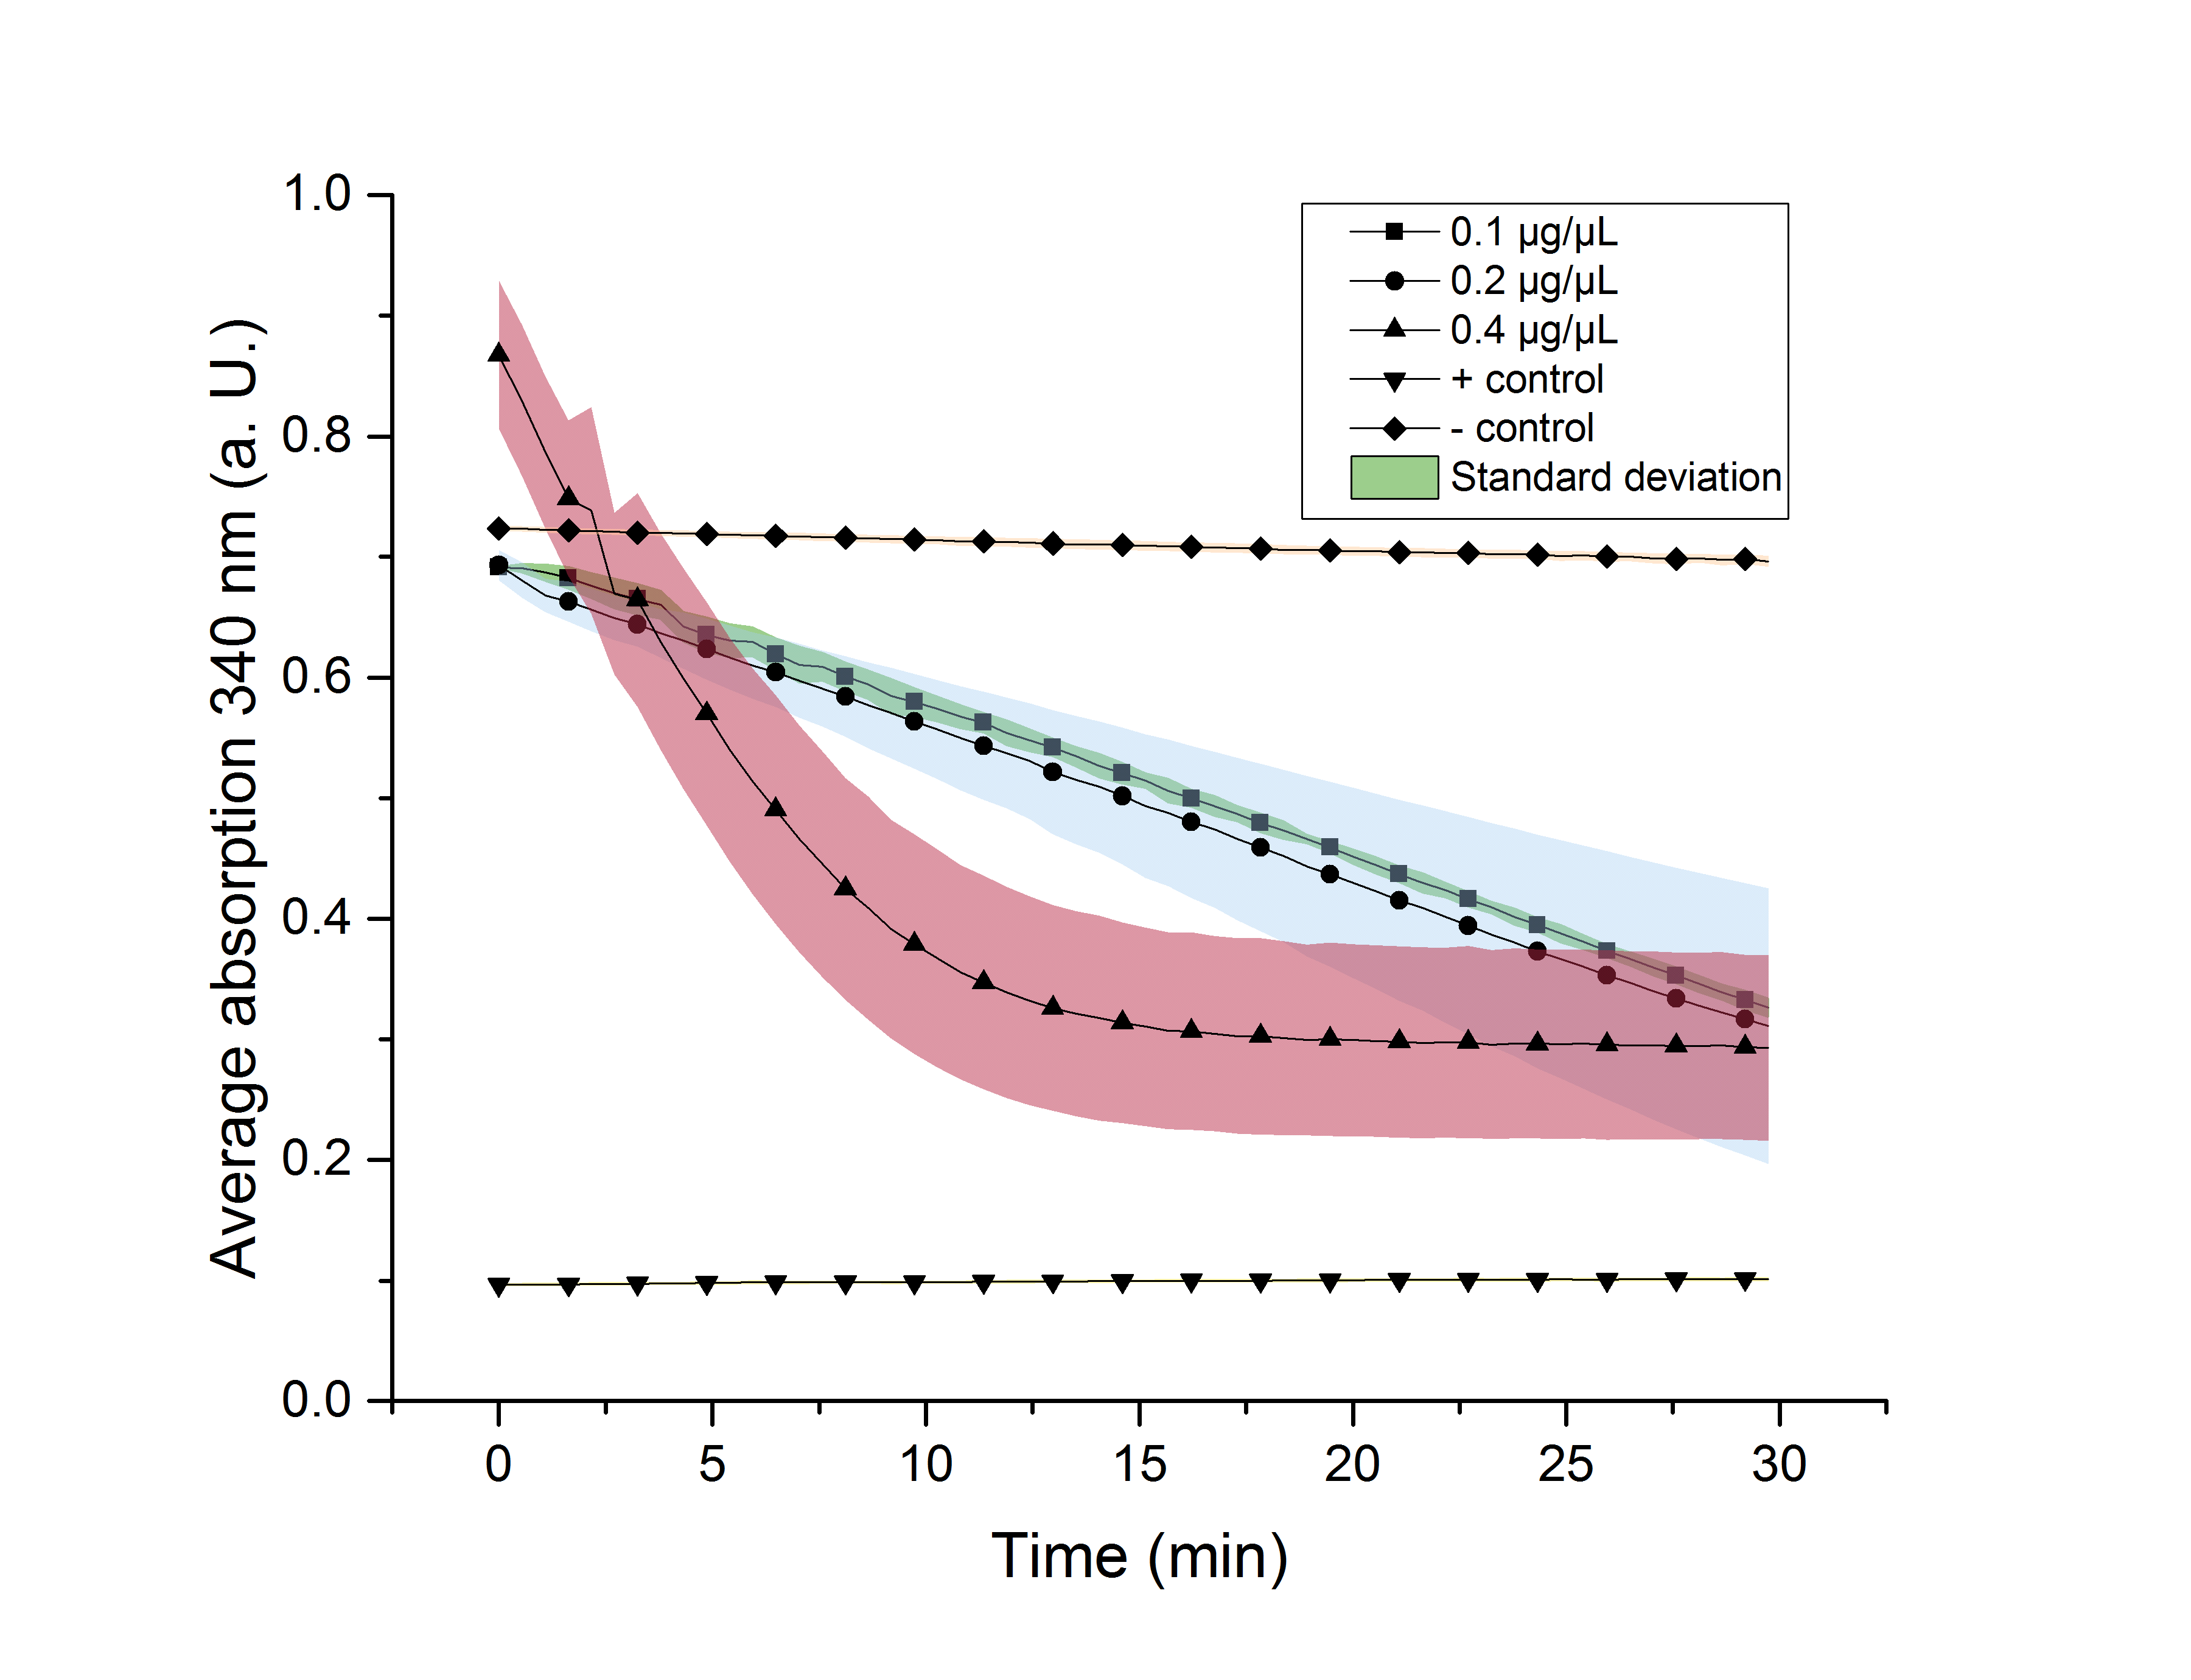
We verified the enzyme activity of YcdW via a NADPH assay with the collected protein fractions from the ÄKTA purification. YcdW oxidizes NADPH to reduce glyoxylate to glycolic acid. NADPH absorbs light at a wavelength of 340 nm, but NADP+ does not. Hence, the absorbance at 340 nm decreases when YcdW is actively turning glyoxylate into glycolic acid. In this experiment we included a positive control, which included NADP+ with enzyme and a negative control, which included NADPH without enzyme. Different enzyme concentrations (0.1 µg/µl; 0.2 µg/µl; 0.4 µg/µl) and temperatures (21 °C/25 °C/37 °C) were tested to find optimal assay conditions.
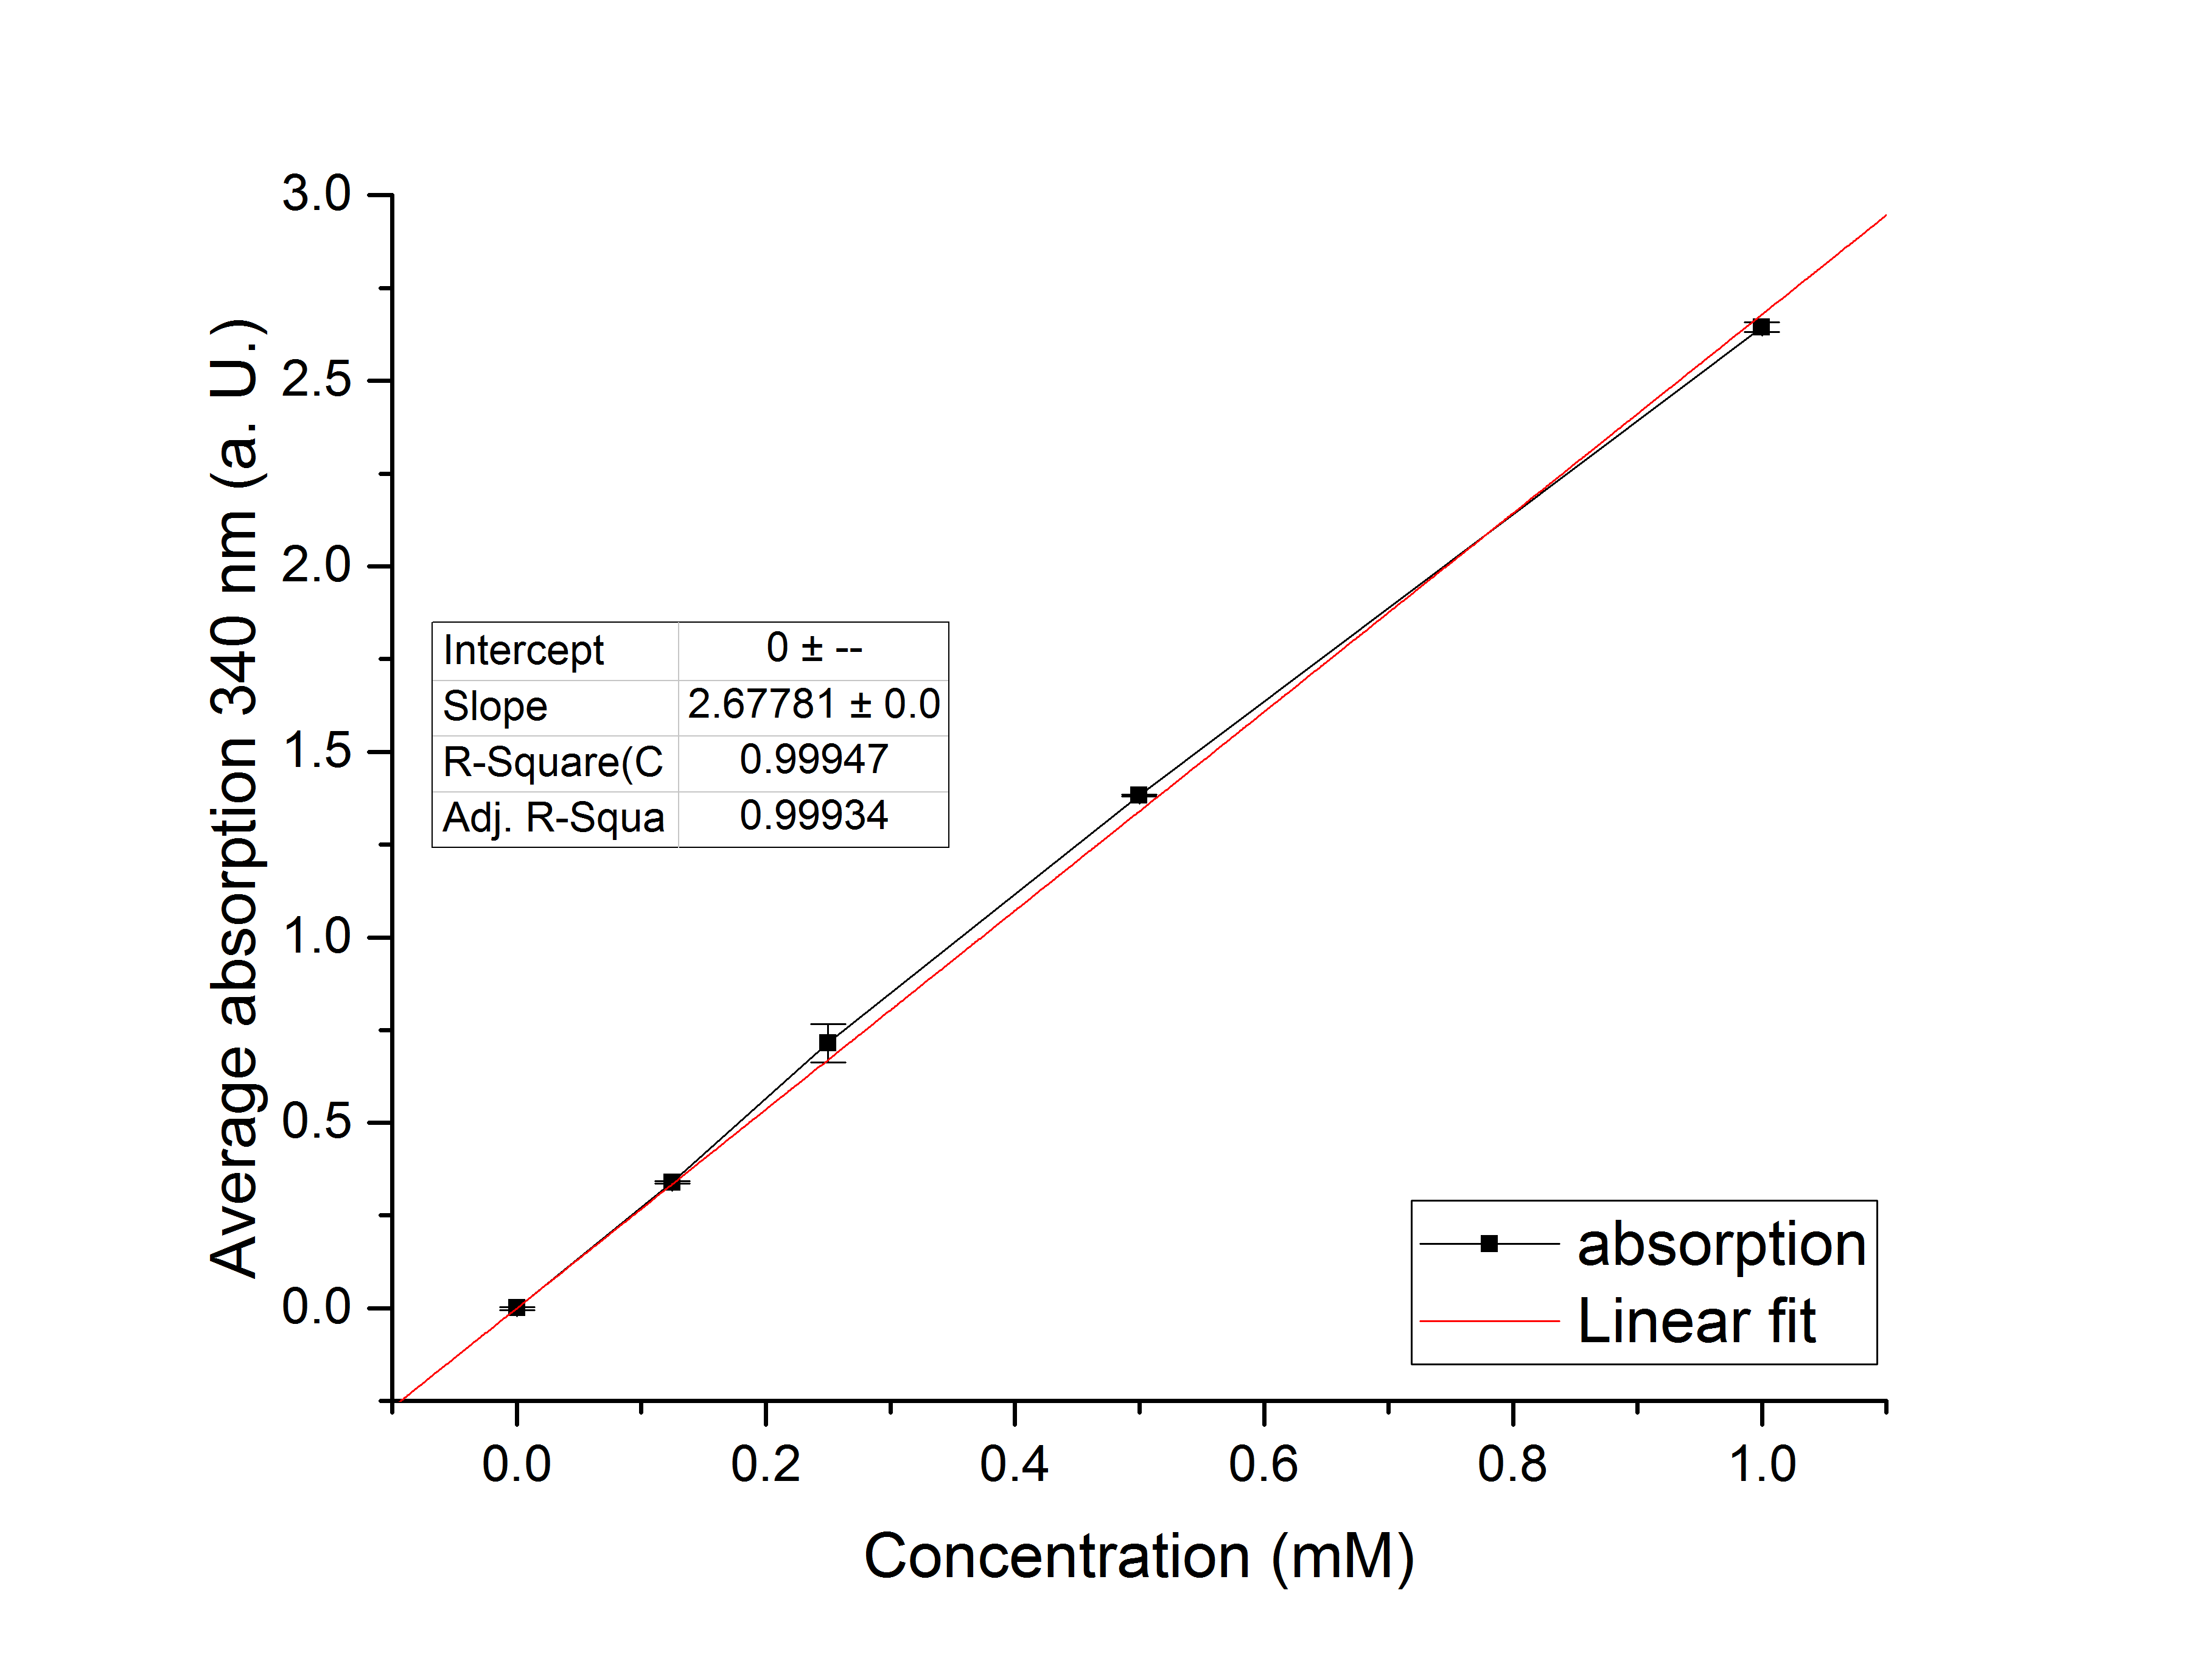
Referring to NUÑEZ et al. (PAPERLINK), we carried out assays with different enzyme concentrations at 25 °C (figure 14). Figure 13 shows the calibration curve for the YcdW assay, which is used to calculate the substrate turnover per time. To create the calibration curve, the absorption of different NADPH concentrations were measured and compared to the resulting assay absorptions (figure 14). Forthe AceA assay it was expected that a higher enzyme concentration would result in a faster substrate conversion.
Figure 13: Figure 6: Calibration curve for YcdW enzyme assay with different NADPH concentrations (1 mM, 0.5 mM, 0.25 mM, 0.125 mM and 0 mM).
Figure 14: NADPH dependent enzyme assay of YcdW at a temperature of 25 °C. The graph shows the average absorption at 340 nm in correlation to the time (min). Different enzyme concentration were used, as well as a postive (NADP+) and negative control (NADPH without enzyme)
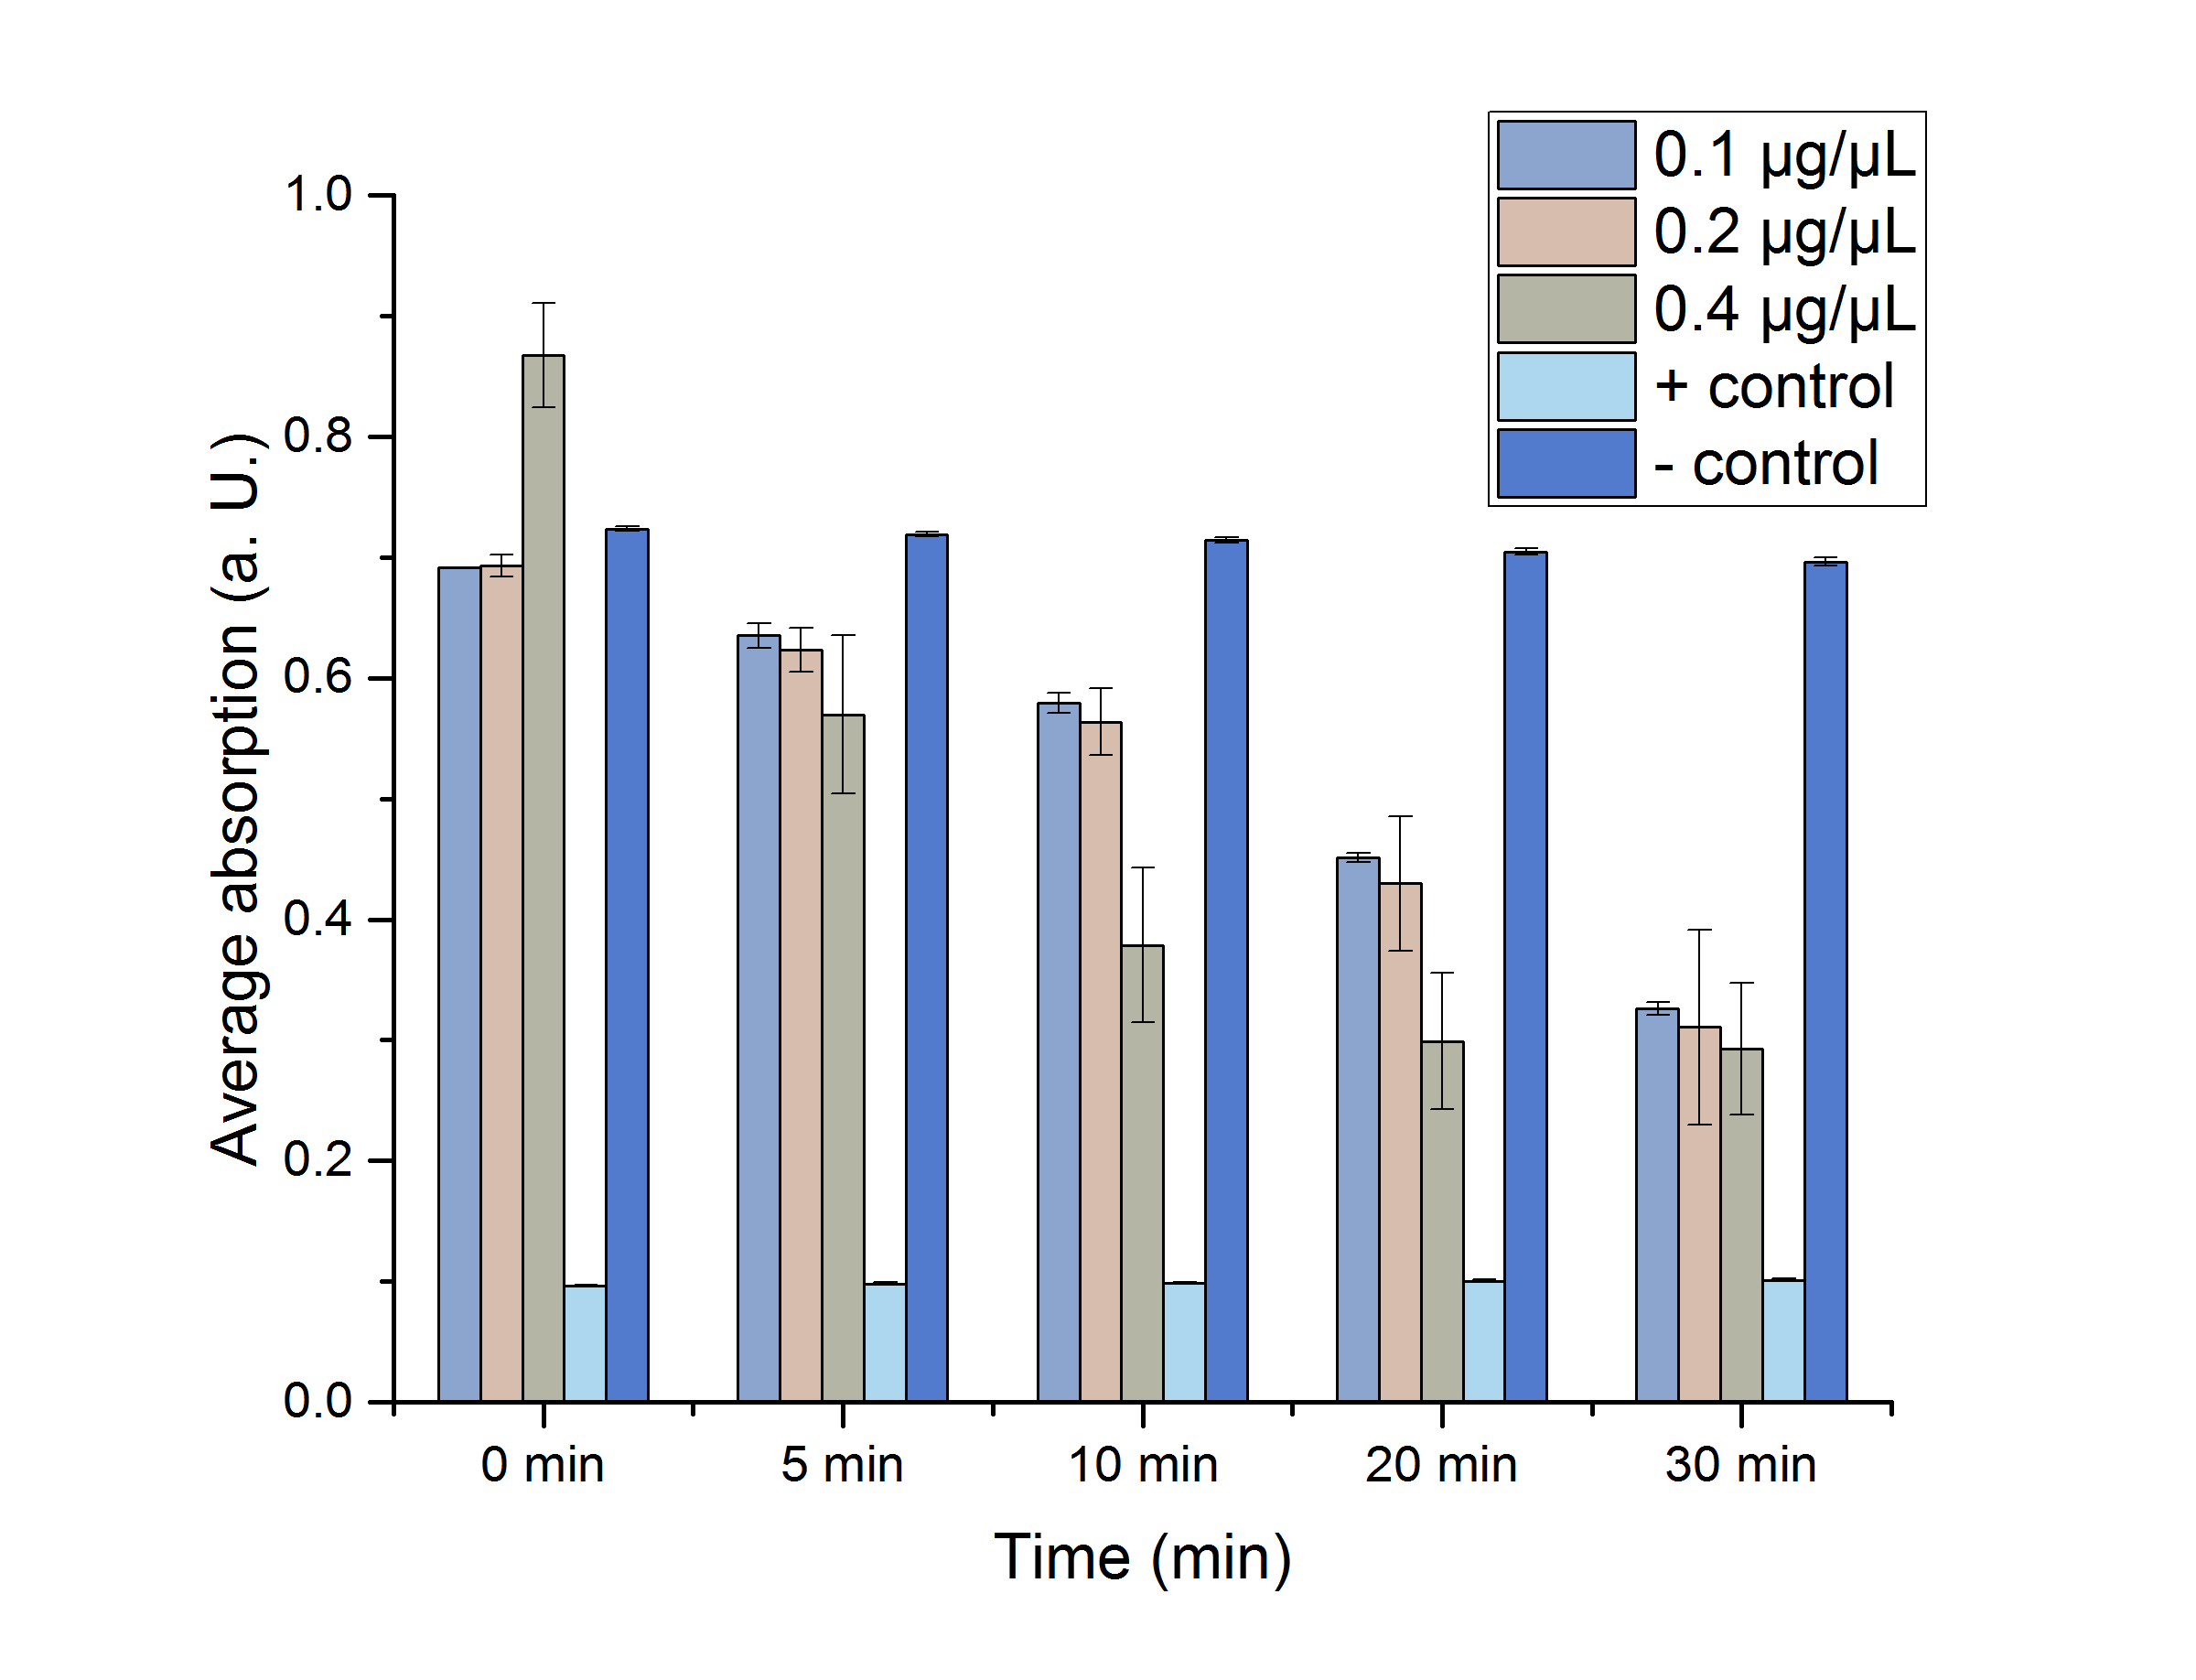
As expected, figure 13 shows that a higher enzyme concentration leads to a faster turnover of glyoxylate. The highest concentration of 0.4 µg/µL reaches an absorption of 0.29 after approximately 15 minutes, which equals a total substrate conversion rate of 0.345 µM/s. Hence, we decided to carry out further analysis regarding the optimal temperature with an enzyme concentration of 0.4 µg/µL. The positive and negative control both stay on a constant absorption level, which indicates that the absorption-decrease of the enzyme containing samples is based on enzymatic activity. However, figure 5 also shows that the enzyme does not reach the level of the positive control, which is presumably due to product inhibition. Evaluating the calibration curve shows, that there must still be a low concentration of NADPH at the end of the assay, which shows that NADPH shortage cannot be a reason for incomplete substrate conversion.
To study the enzyme activity at different temperatures we performed the assay at 21 °C and 37 °C. The substrate conversion per time (µM/s) is shown in table 3. Therefore, the substrate conversion values were recorded in the linear range of the particular curve in a time frame of 3.5 minutes. It should be noted that the determination does not start at the exact same time for all samples, but the time frame of 3.5 minutes was retained. Three replicates were measured for every assay.
Table 3: Substrate conversion of YcdW per time (µM/s) in correlation to different temperature (21° C, 25° C and 37° C)
| Temperature [°C] | Substrate conversion
per second [µM/s] |
|---|---|
| 21 | 0.31 |
| 25 | 0.345 |
| 37 | 0.26 |
Table 3 shows that the enzyme performs best at a temperature of 25 °C with a substrate conversion of 0.345 µM/s, followed by a conversion rate of 0.31 µM/s at 21 °C. At a temperature of 37 °C the enzyme shows its lowest conversion rate of 0.26 µM/s.
After showing that the YcdW enzyme performs best at a temperature of 25 °C, a Student's t-test was performed to check the significance of our data. Five different data sets (0, 5, 10, 20, 30 min) were chosen (table 4).
Table 4: Calculated significance of YcdW data sets for 0, 5, 10, 20 and 30 minutes, 25 °C. The table also shows the NADPH-absorption as well as the particular standard error. A= Absorption, *= Significance (p-value < 0.05), n= 3
| YcdW [µg/µL] | A (t=0 min) | A (t=5 min) | A (t=10 min) | A (t=20 min) | A (t=30 min) |
|---|---|---|---|---|---|
| 0.1 | 0.691±0.0003* | 0.635±0.01* | 0.58±0.008* | 0.451±0.004* | 0.326±0.005* |
| 0.2 | 0.693±0.009 | 0.623±0.018* | 0.563±0.028* | 0.429±0.056* | 0.31±0.08* |
| 0.4 | 0.868±0.043 | 0.57±0.07 | 0.38±0.064* | 0.3±0.06* | 0.293±0.054* |
| pos. | 0.096±0.0008* | 0.098±0.001* | 0.099±0.001* | 0.1±0.001* | 0.101±0.001* |
| neg. | 0-724±0.0017 | 0.719±0.002 | 0.714±0.002 | 0.705±0.003 | 0.696±0.003 |
As shown in table 4, most of the data points show a p-value < 0.05, which indicates that the data is significant. For a better visualization, the data sets are plotted in figure 15.
Figure 15: Enzyme assay absorption for 0, 5, 10, 20 and 30 minutes with standard error. n=3
The results show significantly that the glyoxylate reductase YcdW performs best at 25 °C and the highest concentration of 0.4 µg/µL, which allows a further characterization of the reaction and production of the desired monomer glycolic acid via High-performance liquid chromatography (HPLC).
HPLC analysis
In order to verify the production of glycolic acid (product of YcdW) and its precursor glyoxylate (product of AceA) high-performance liquid chromatography (HPLC) was performed. Therefore, we used four different samples:
1. In vitro YcdW assay with NADPH surplus (figure 16)
2. In vitro AceA assay (figure 17)
3. In vitro YcdW with AceA in YcdW reaction buffer (figure 18)
4. Analysis of disrupted ycdW-transformed E. coli cells (figure 19)
The three in vitro assays were performed as described in section 1.3.4. The in vitro assay containing both enzymes was carried out in the YcdW reaction buffer to analyze the simultaneous performance of both enzymes.
In order to analyze the in vivo production of glycolic acid YcdW-transformed E. coli cells were disrupted and centrifuged. The supernatant was sterile-filtered and analyzed.
The used external references showed the following retention times:
1. Isocitrat: 10.25 min
2. Glyoxylate: 12.193 min
3. Glycolic acid: 15.749 min
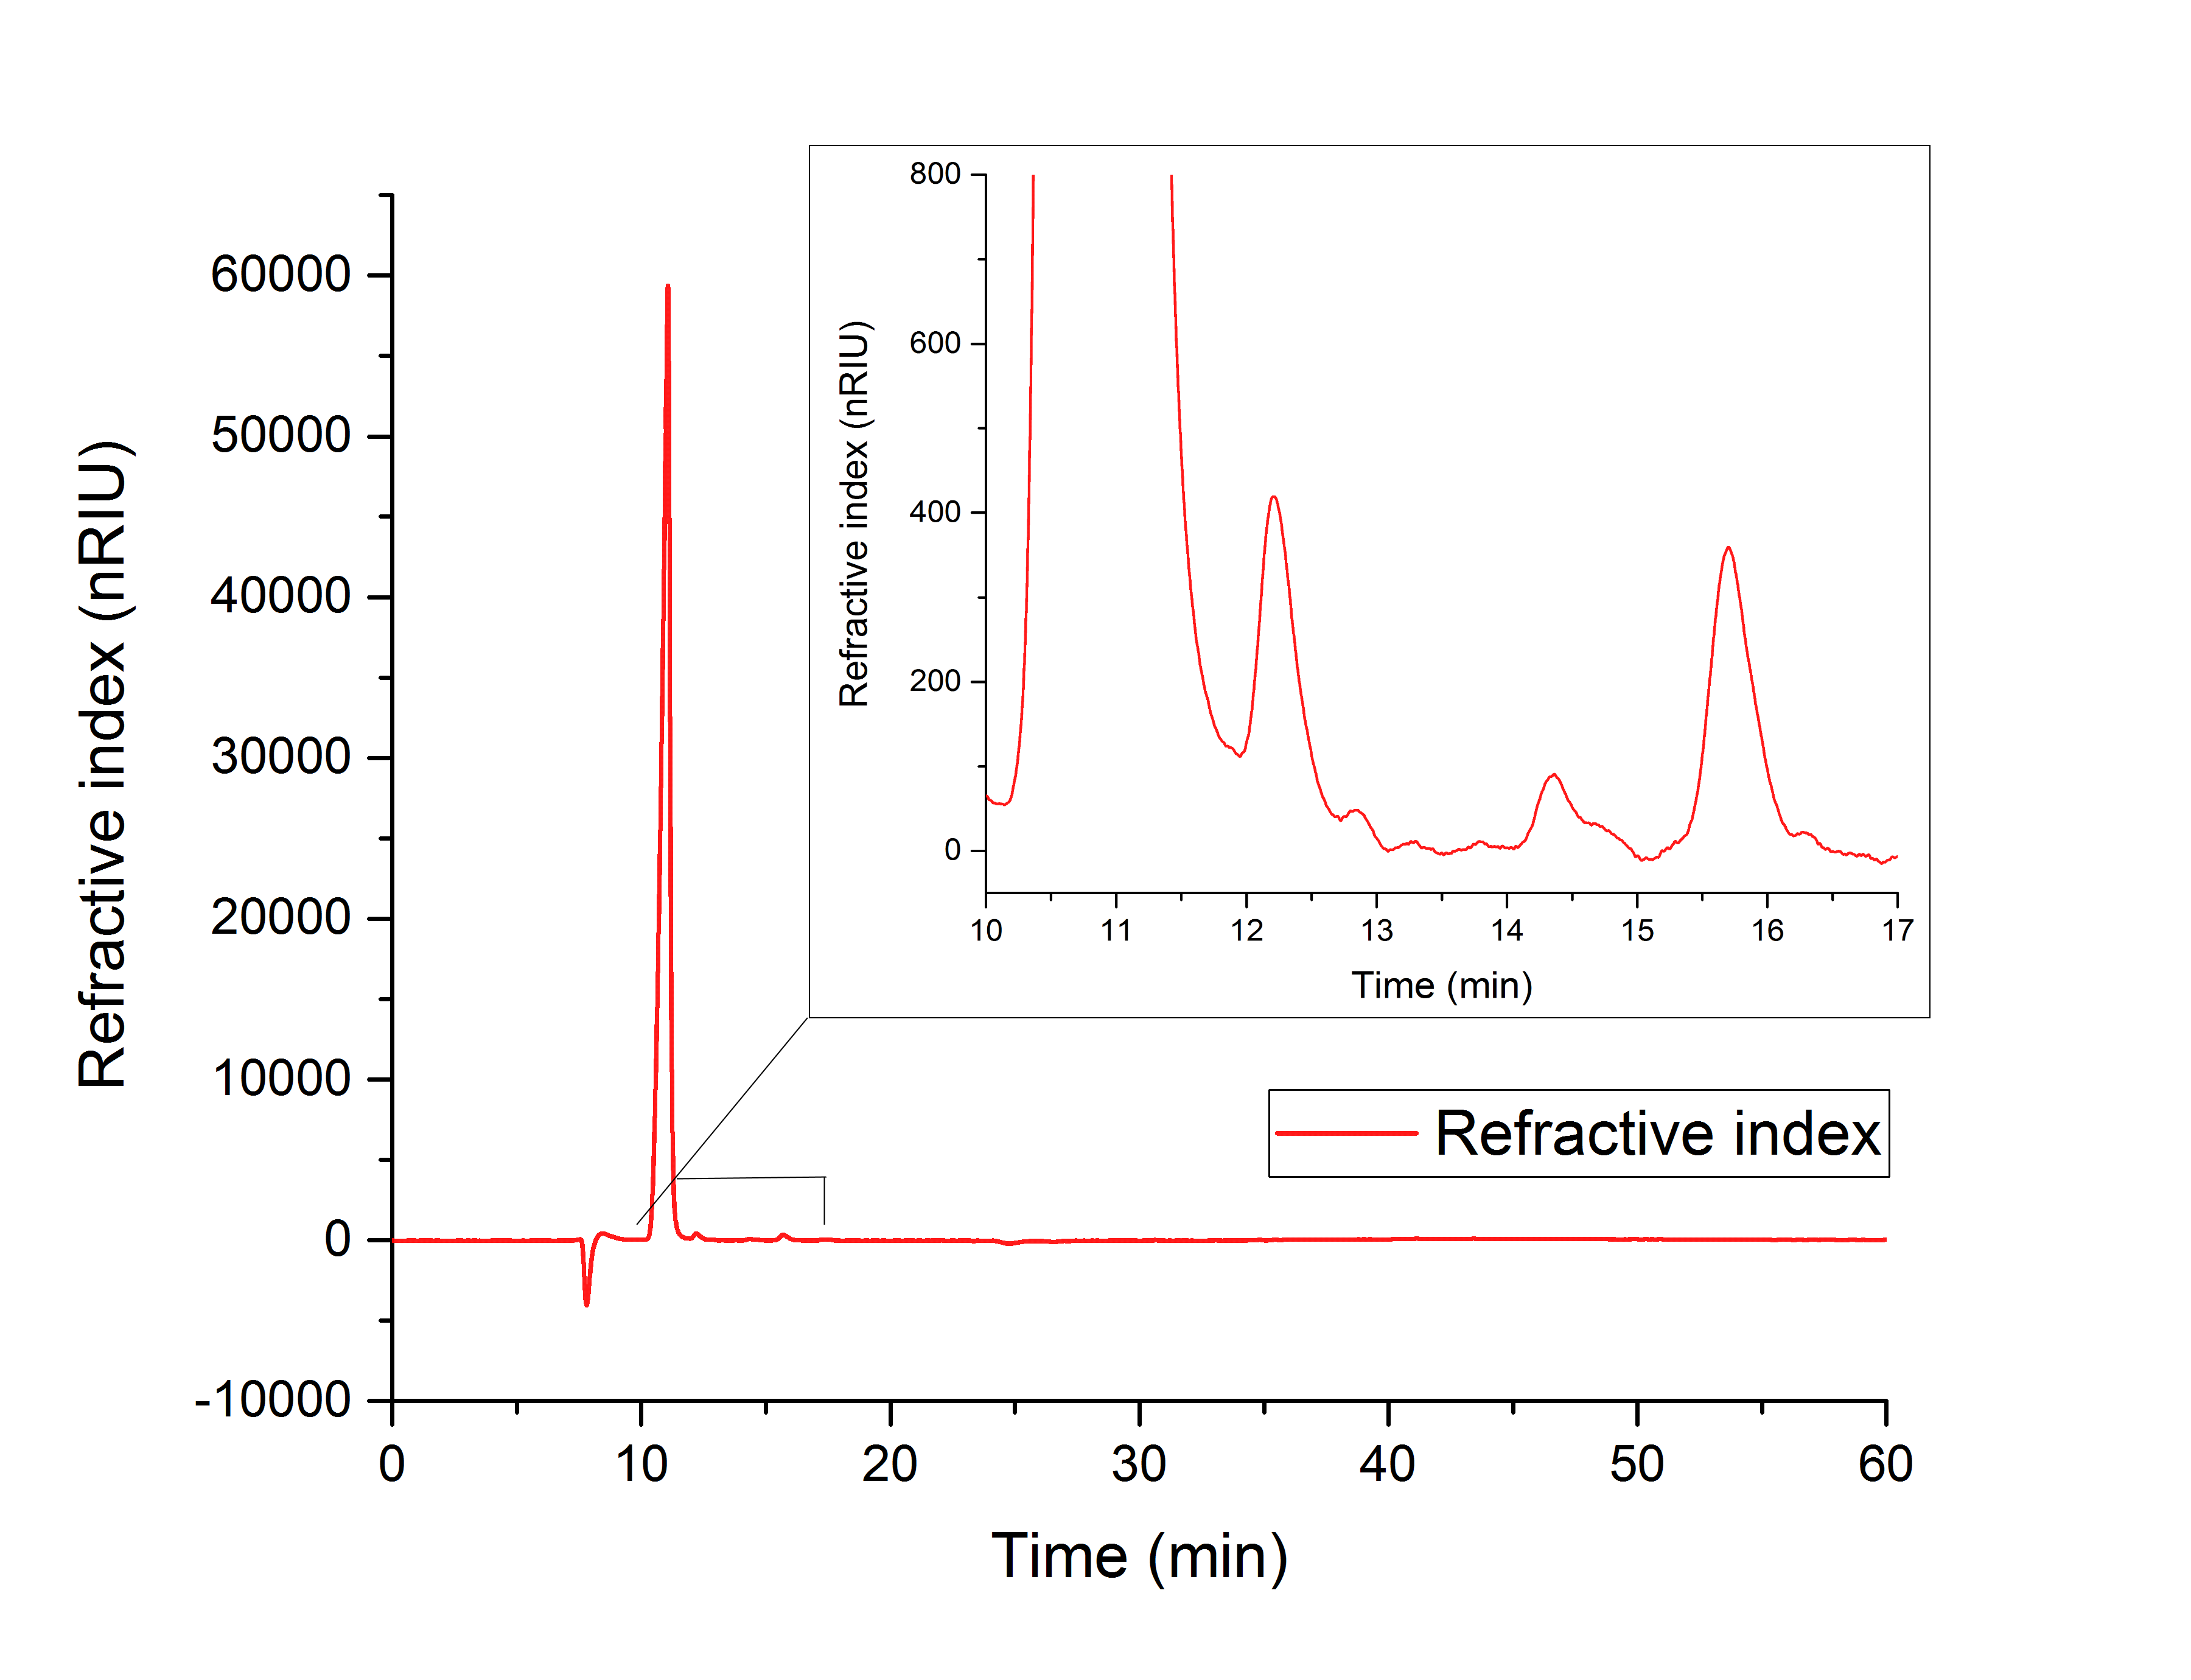
For assay 1 (figure 16) a peak after 15.701 minutes confirms the production of glycolic acid from glyoxylate (12.210 min).
Figure 16: HPLC analysis of YcdW in vitro enzyme assay with NADPH surplus. Glycolic acid peak can be seen at 15.701 minutes and glyoxylate peak at 12.210 minutes.
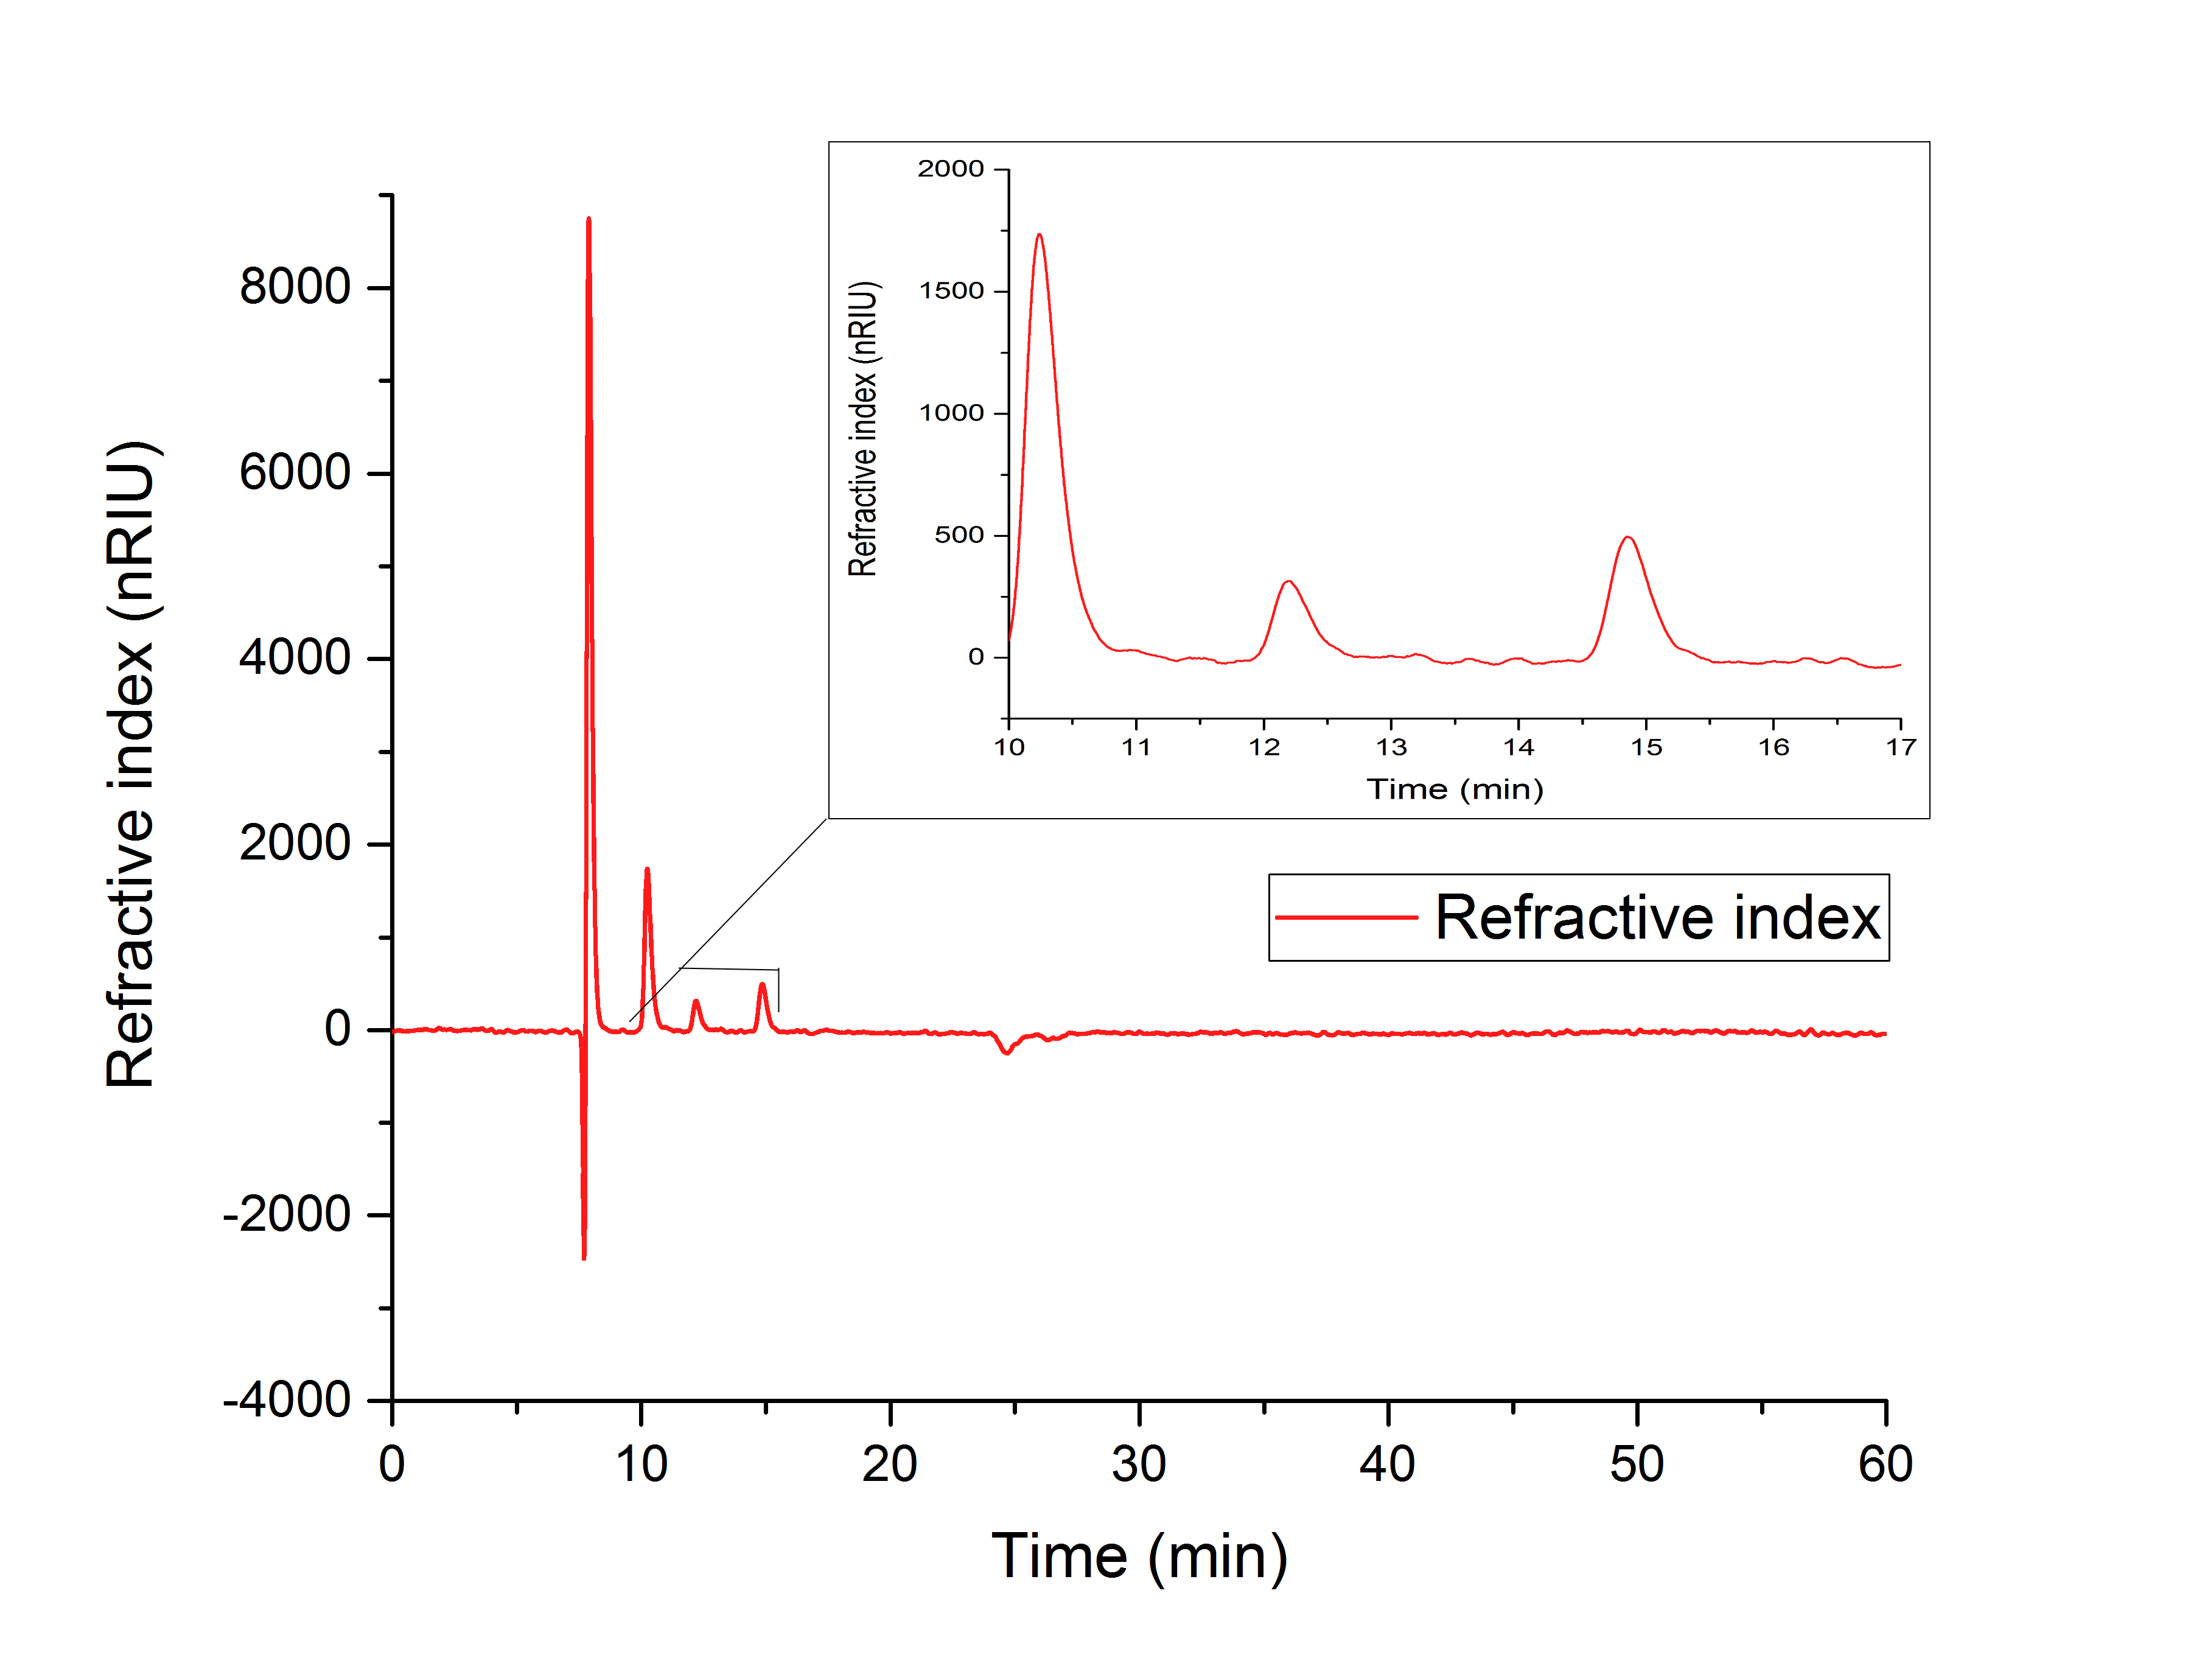
Figure 17 indicates the production of glyoxylate with a retention time of 12.195 minutes from isocitrate (10.240 min).
Figure 17: HPLC analysis of AceA in vitro assay. Production of glyoxylate is indicated by a peak at 12.195 minutes. The precursor isocitrat shows a peak at 10.240 minutes.
While testing the parallel performance of YcdW and AceA, a white precipitate was noticed. Since the HPLC (figure 18) shows no peaks for neither glyoxylate nor glycolic acid, it is likely that AceA precipitated in the potassium phosphate buffer, resulting in a loss of catalytic activity.
Figure 18: HPLC analysis of in vitro assay containing both desired enzymes in the YcdW reaction buffer. No expected retention times can be seen.
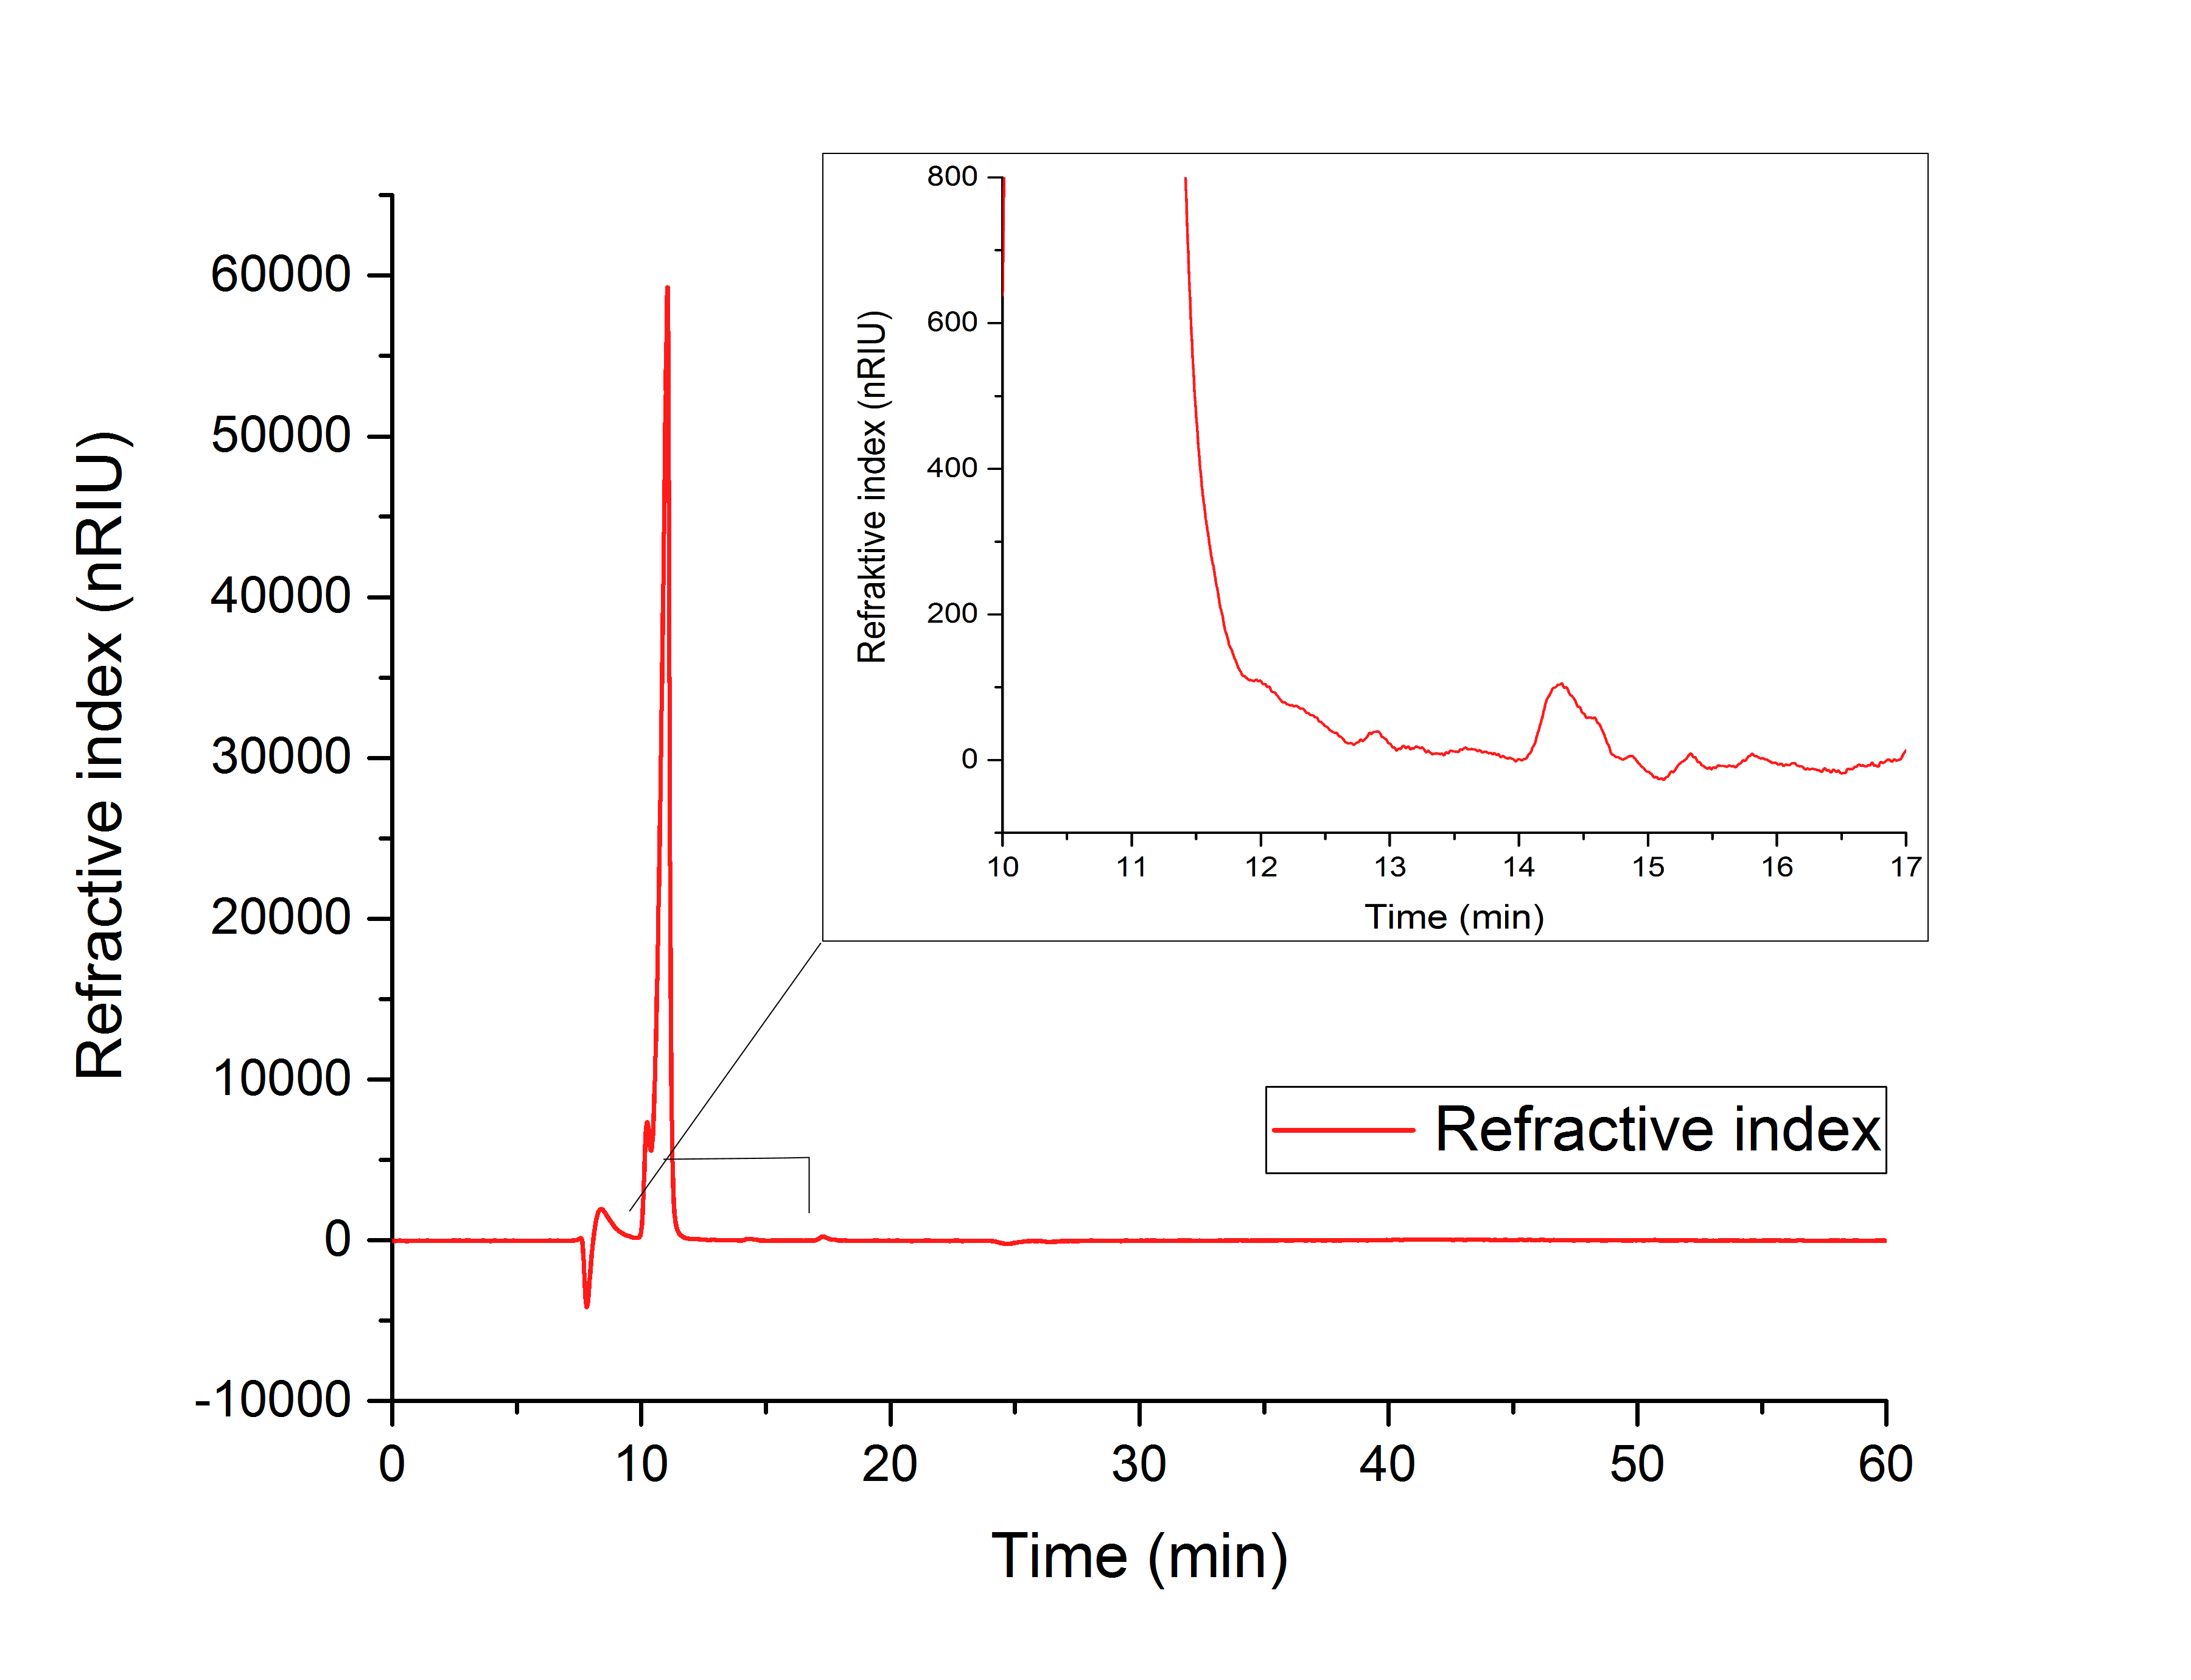
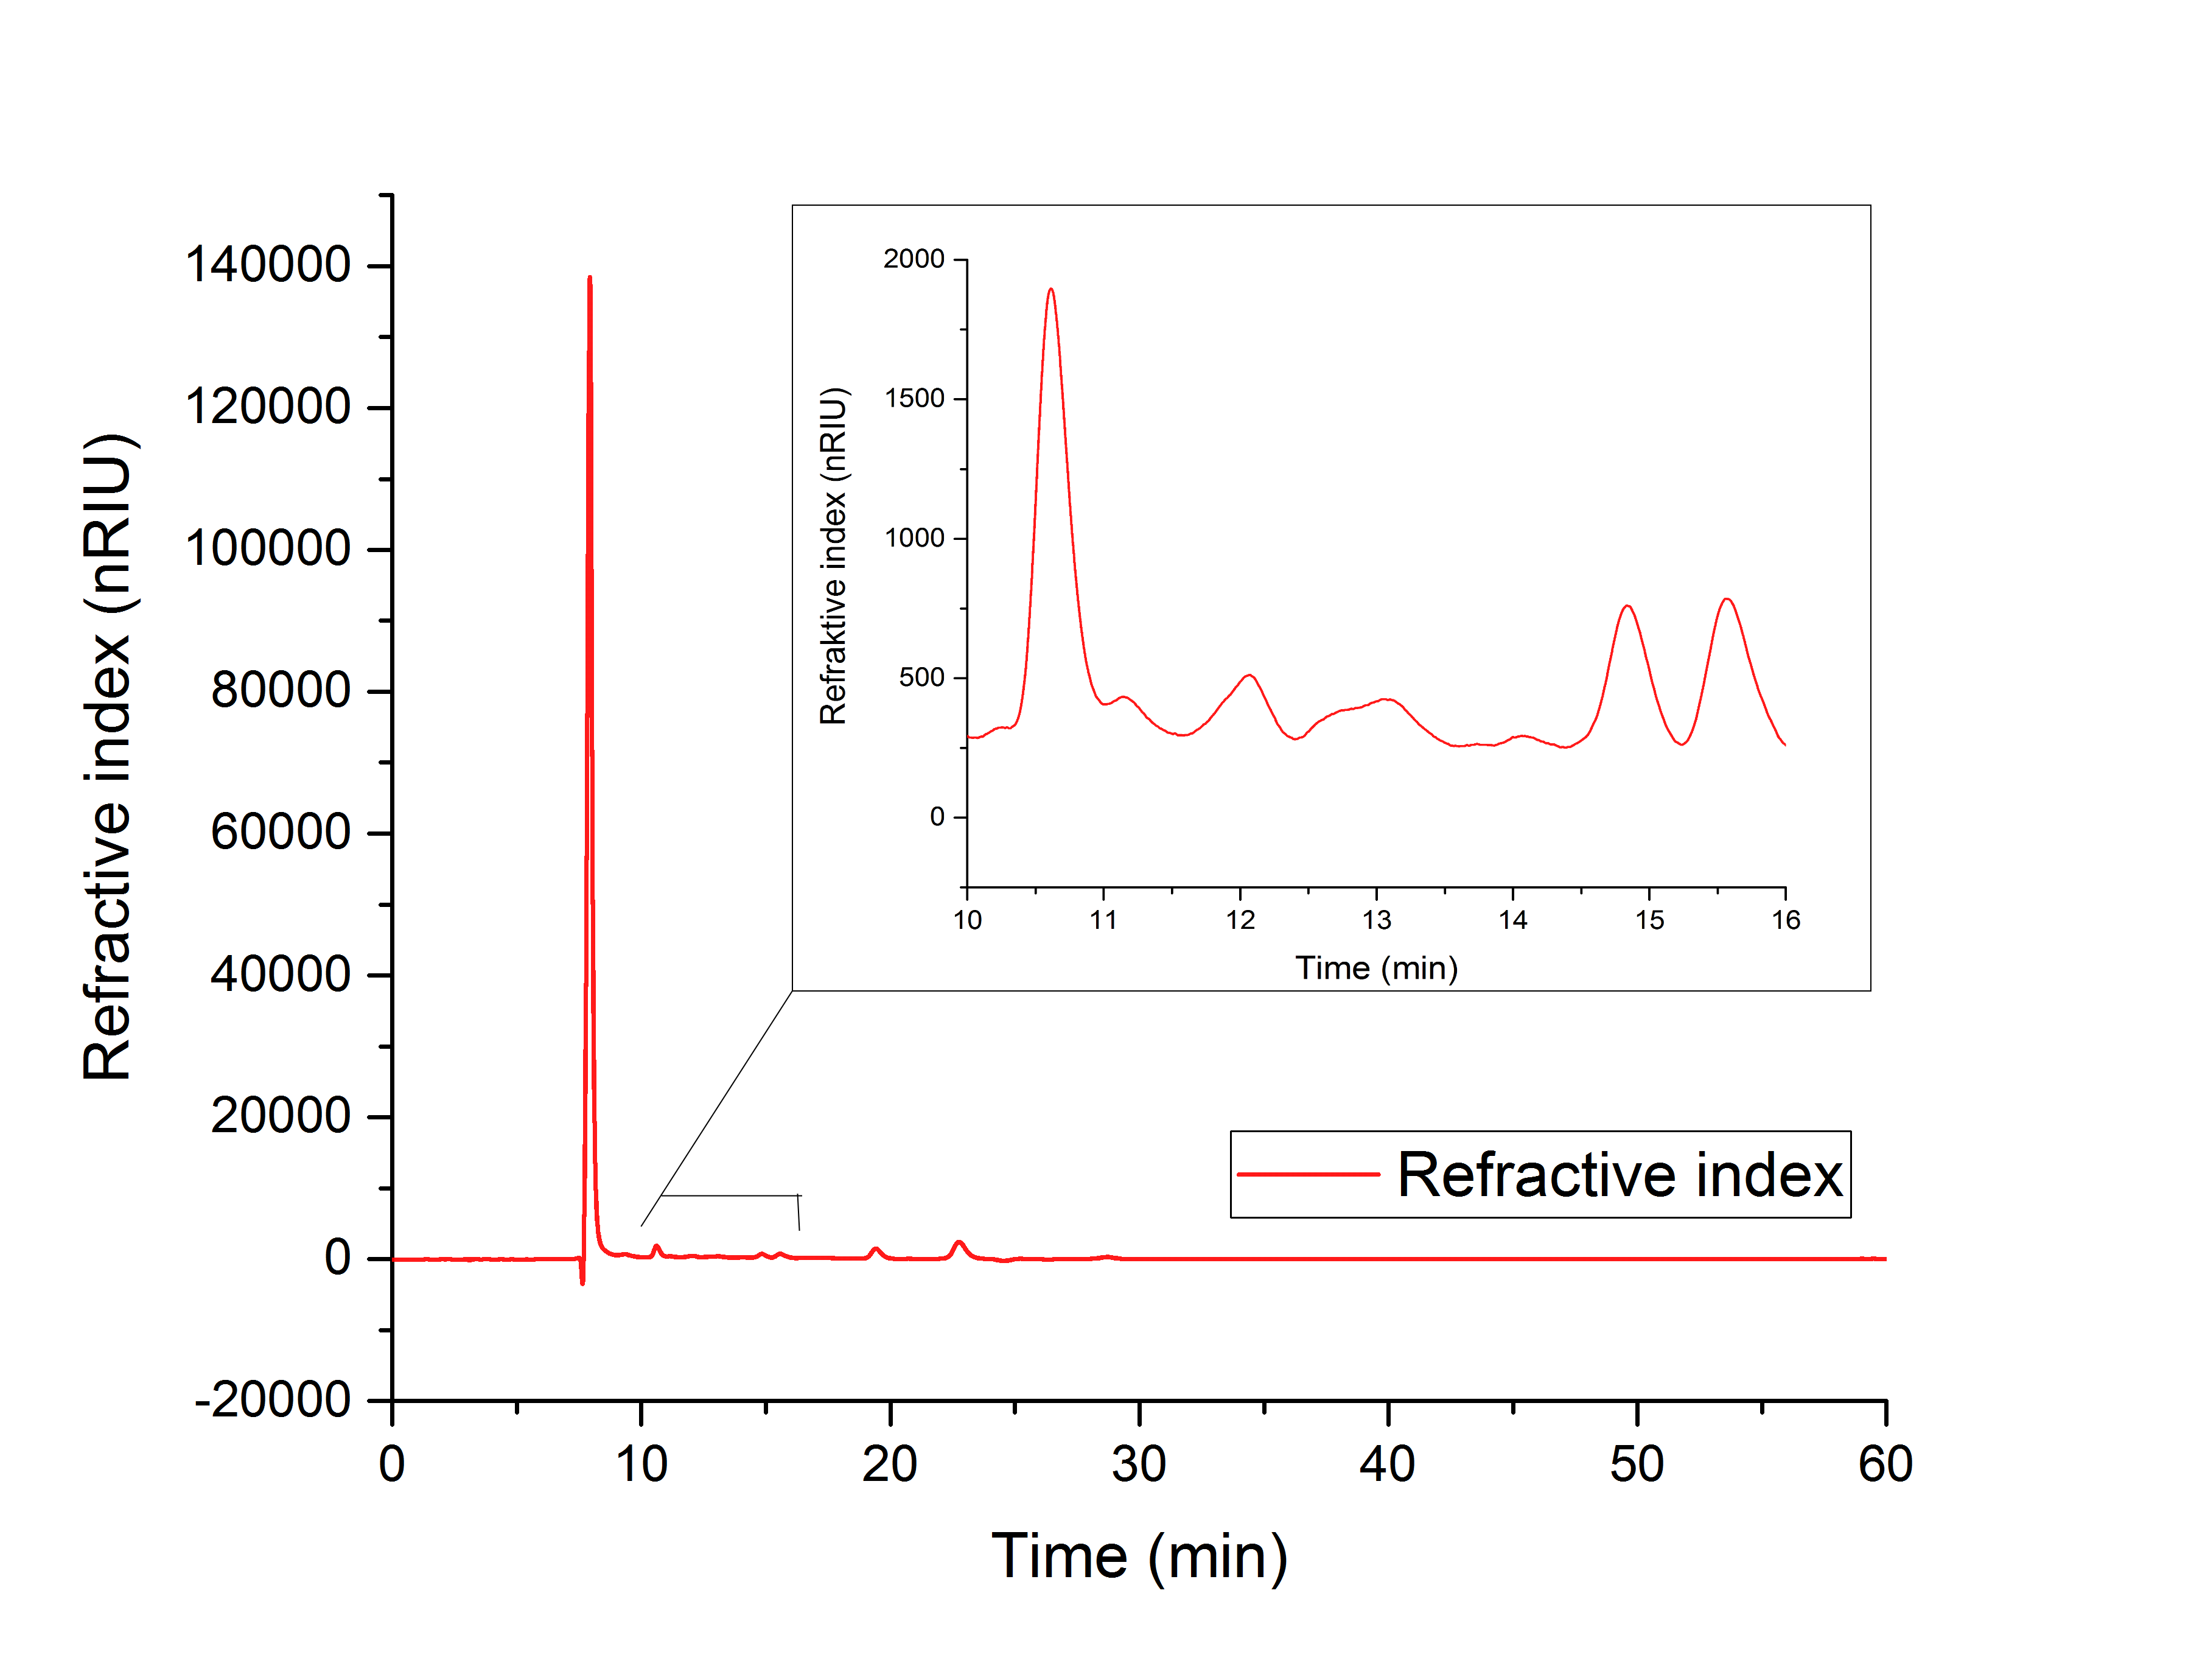
The cell lysate (figure 19) shows, besides others, peaks corresponding to the retention time of glyoxylate (12.066 min) and glycolic acid (15.568). It can therefore be concluded that the production of glycolic acid in E.Coli was successful.
Figure 19: HPLC analysis of supernatant of disrupted ycdW transformed E. coli cells. Glyoxylate and glycolic acid peaks can be seen at 12.066 minutes and 15.568 minutes.
M9 growth assay
HIER FEHLEN NOCH CA. 5 ZEILEN ÜBER DIE ERGEBNISSE DES M9 GROWTH ASSAYS, SOWIE DER ENTSPRECHENDE GRAPH DAZU.
GRAPH MUSS NOCH AUSGETAUSCHT WERDEN
Outlook
We aimed for a more sustainable, environment-friendly production of glycolic acid, which can be used as component of the biodegradable polymer PLGA. To achieve this, we genetically engineered Escherichia coli and demonstrated the in vivo and in vitro bioproduction of glycolic acid. Hence, our approach enables the future production of PLGA polymers independently from fossil resources.
However, to make this process profitable, production titers have to be increased. Therefore, we suggest the following optimization steps: Currently, we use a two-plasmid system, harboring the genes ycdW and aceA, to express the biosynthesis pathway in E. coli. To minimize the metabolic burden on E. coli, both enzymes shall be either encoded on one single plasmid or their genes shall be genomically integrated in E. coli. Furthermore, counteracting enzymes, e.g. aceB (CITE/ https://www.uniprot.org/uniprot/D4GTL2), lower the metabolite pool of our pathway and thereby decreasing product titers. Hence, we suggest the deletion of such counteracting enzymes.
To further increase titers, it is possible to fine-tune the expression ratios of our genes, considering their enzyme activities, co-factor dependencies, titers of glycolic acid and the growth rate of E. coli. Several synthetic metabolic channeling approaches may also increase titers (CITE: https://www.nature.com/articles/nbt.1557 and https://www.nature.com/articles/nchembio.2535).
For an enhanced in vitro production, we suggest the optimization of the reaction buffer, including its pH, to simultaneously use both key enzymes. We also see space for improvements in fine-tuning substrate and co-factor concentrations.
Considering all these aspects, we are optimistic that an optimized glycolic acid production in E. coli has the potential to replace the petrochemical-dependent PLGA production.


