Contents
Caprolactone Production in E. coli
Abstract
Our aim was to produce ε-caprolactone in E. coli. ε-caprolactone can be used in Poly(lactide-co-glycolide-co-caprolactone) abbreviated PLGC to tailor degradation time by enhancing diffusion rates. ε-caprolactone is non-toxic and can be mixed with different polymers to form materials with the desired set of properties, making it a prime candidate for future medical applications. In order to produce ε-caprolactone, the cyclohexanone monooxygenase (chmo) was introduced into E. coli. CHMO utilizes NADPH as a co-factor to produce ε-caprolactone from cyclohexanone. To replenish the NADPH used up in this process, as well as oxidize cyclohexanol to cyclohexanone, the alcohol dehydrogenase (adh) was as well introduced into E. coli. In the end we successfully characterized our enzymes and verified their function through a NADPH-dependent assay. We therefore created a pair of BioBricks allowing the community to produce ε-caprolactone, and submitted them to the iGEM Registry (CHMO and ADH).
Introduction
ε-caprolactone is a seven-membered circular lactone. It is used as a building block for several polymers, like in our case PLGC. The ε-caprolactone decreases the degradation time of a polymer by making ester bonds easier accessible for water molecules[1]. Therefore, polymers with caprolactones have a shorter lifetime than polymers without them. Right now, ε-caprolactone is derived from petrochemicals and further chemicals, which are harmful for living beings and their environment. In order to produce ε-caprolactone in E. coli, we used the two enzymes, cyclohexanone monooxygenase (CHMO) and alcohol dehydrogenase (ADH).
Figure 1: Reaction sequence of ADH and CHMO.
The most important enzyme for the production of ε-caprolactone in E. coli is cyclohexanone monooxygenase (CHMO). The variant used in this project is derived from Acinetobacter calcoaceticus and has a molecular weight of 60.9 kDa. CHMO is a Baeyer-Villiger monoxygenase, which catalyses the direct conversion from a ketone into an ester. In our case, CHMO catalyzes the conversion from cyclohexanone into ε-caprolactone. The enzyme requires oxygen as well as the co-factor NADPH to catalyze this reaction. Since the wildtype of the enzyme is unstable and therefore consequently unsuitable for large scale application, a double mutant of CHMO has been used in this project (C376L/M400I)[2]. These mutations lead to an higher tolerance against oxidation, and consequently lead to an enhanced stability and functionality of CHMO.
Figure 2: Structure of the NADPH-dependent cyclohexanone monooxygenase with a molecular weight of 60.9 kDa..
The other enzyme we used is alcohol dehydrogenase (ADH) from Lactobacillus kefir which has a molecular weight of 26.8 kDa. ADH has two functions. First, it converts cyclohexanol into cyclohexanone and secondly, it recycles the cofactor NADP+ to NADPH, enabling further CHMO activity. Hence, the combination of these two enzymes makes the process self-sustaining.
Figure 3: Structure of the NADP+-dependent alcohol dehydrogenase with a molecular weight of 26.8 kDa.
In order to achieve a maximal output the enzymes should be used in a 1:10 ratio (ADH:CHMO)[2].
Methods
The following methods have been applied in our lab work:
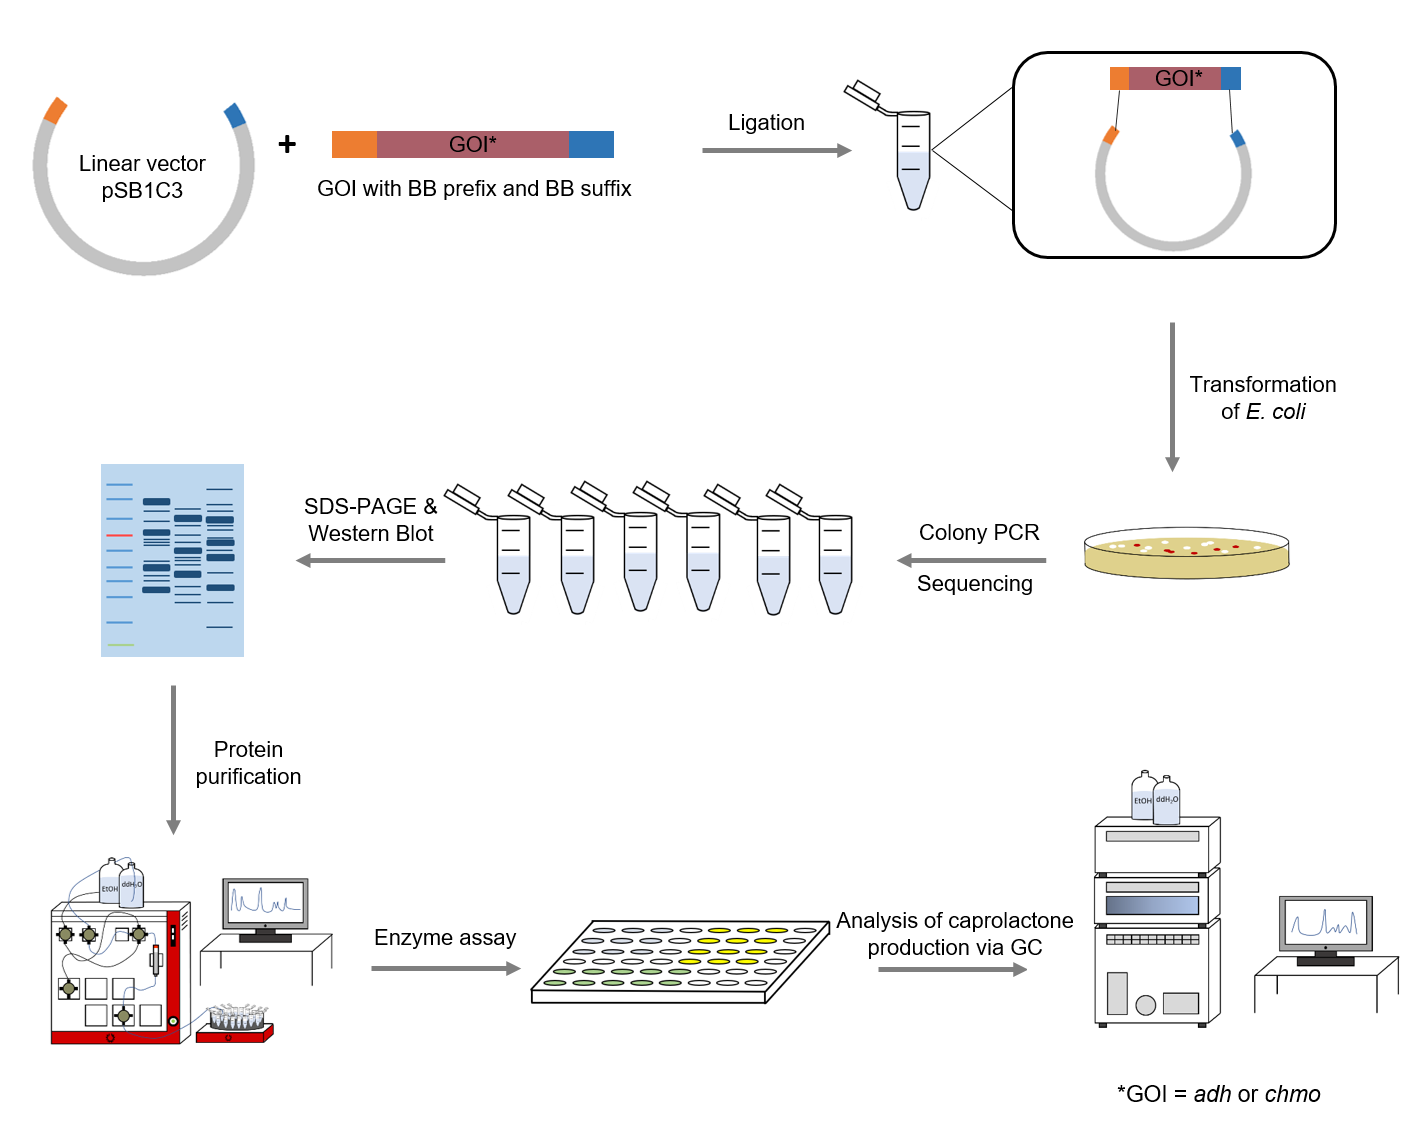
Figure 4: Schematic representation of work flow.
Cloning
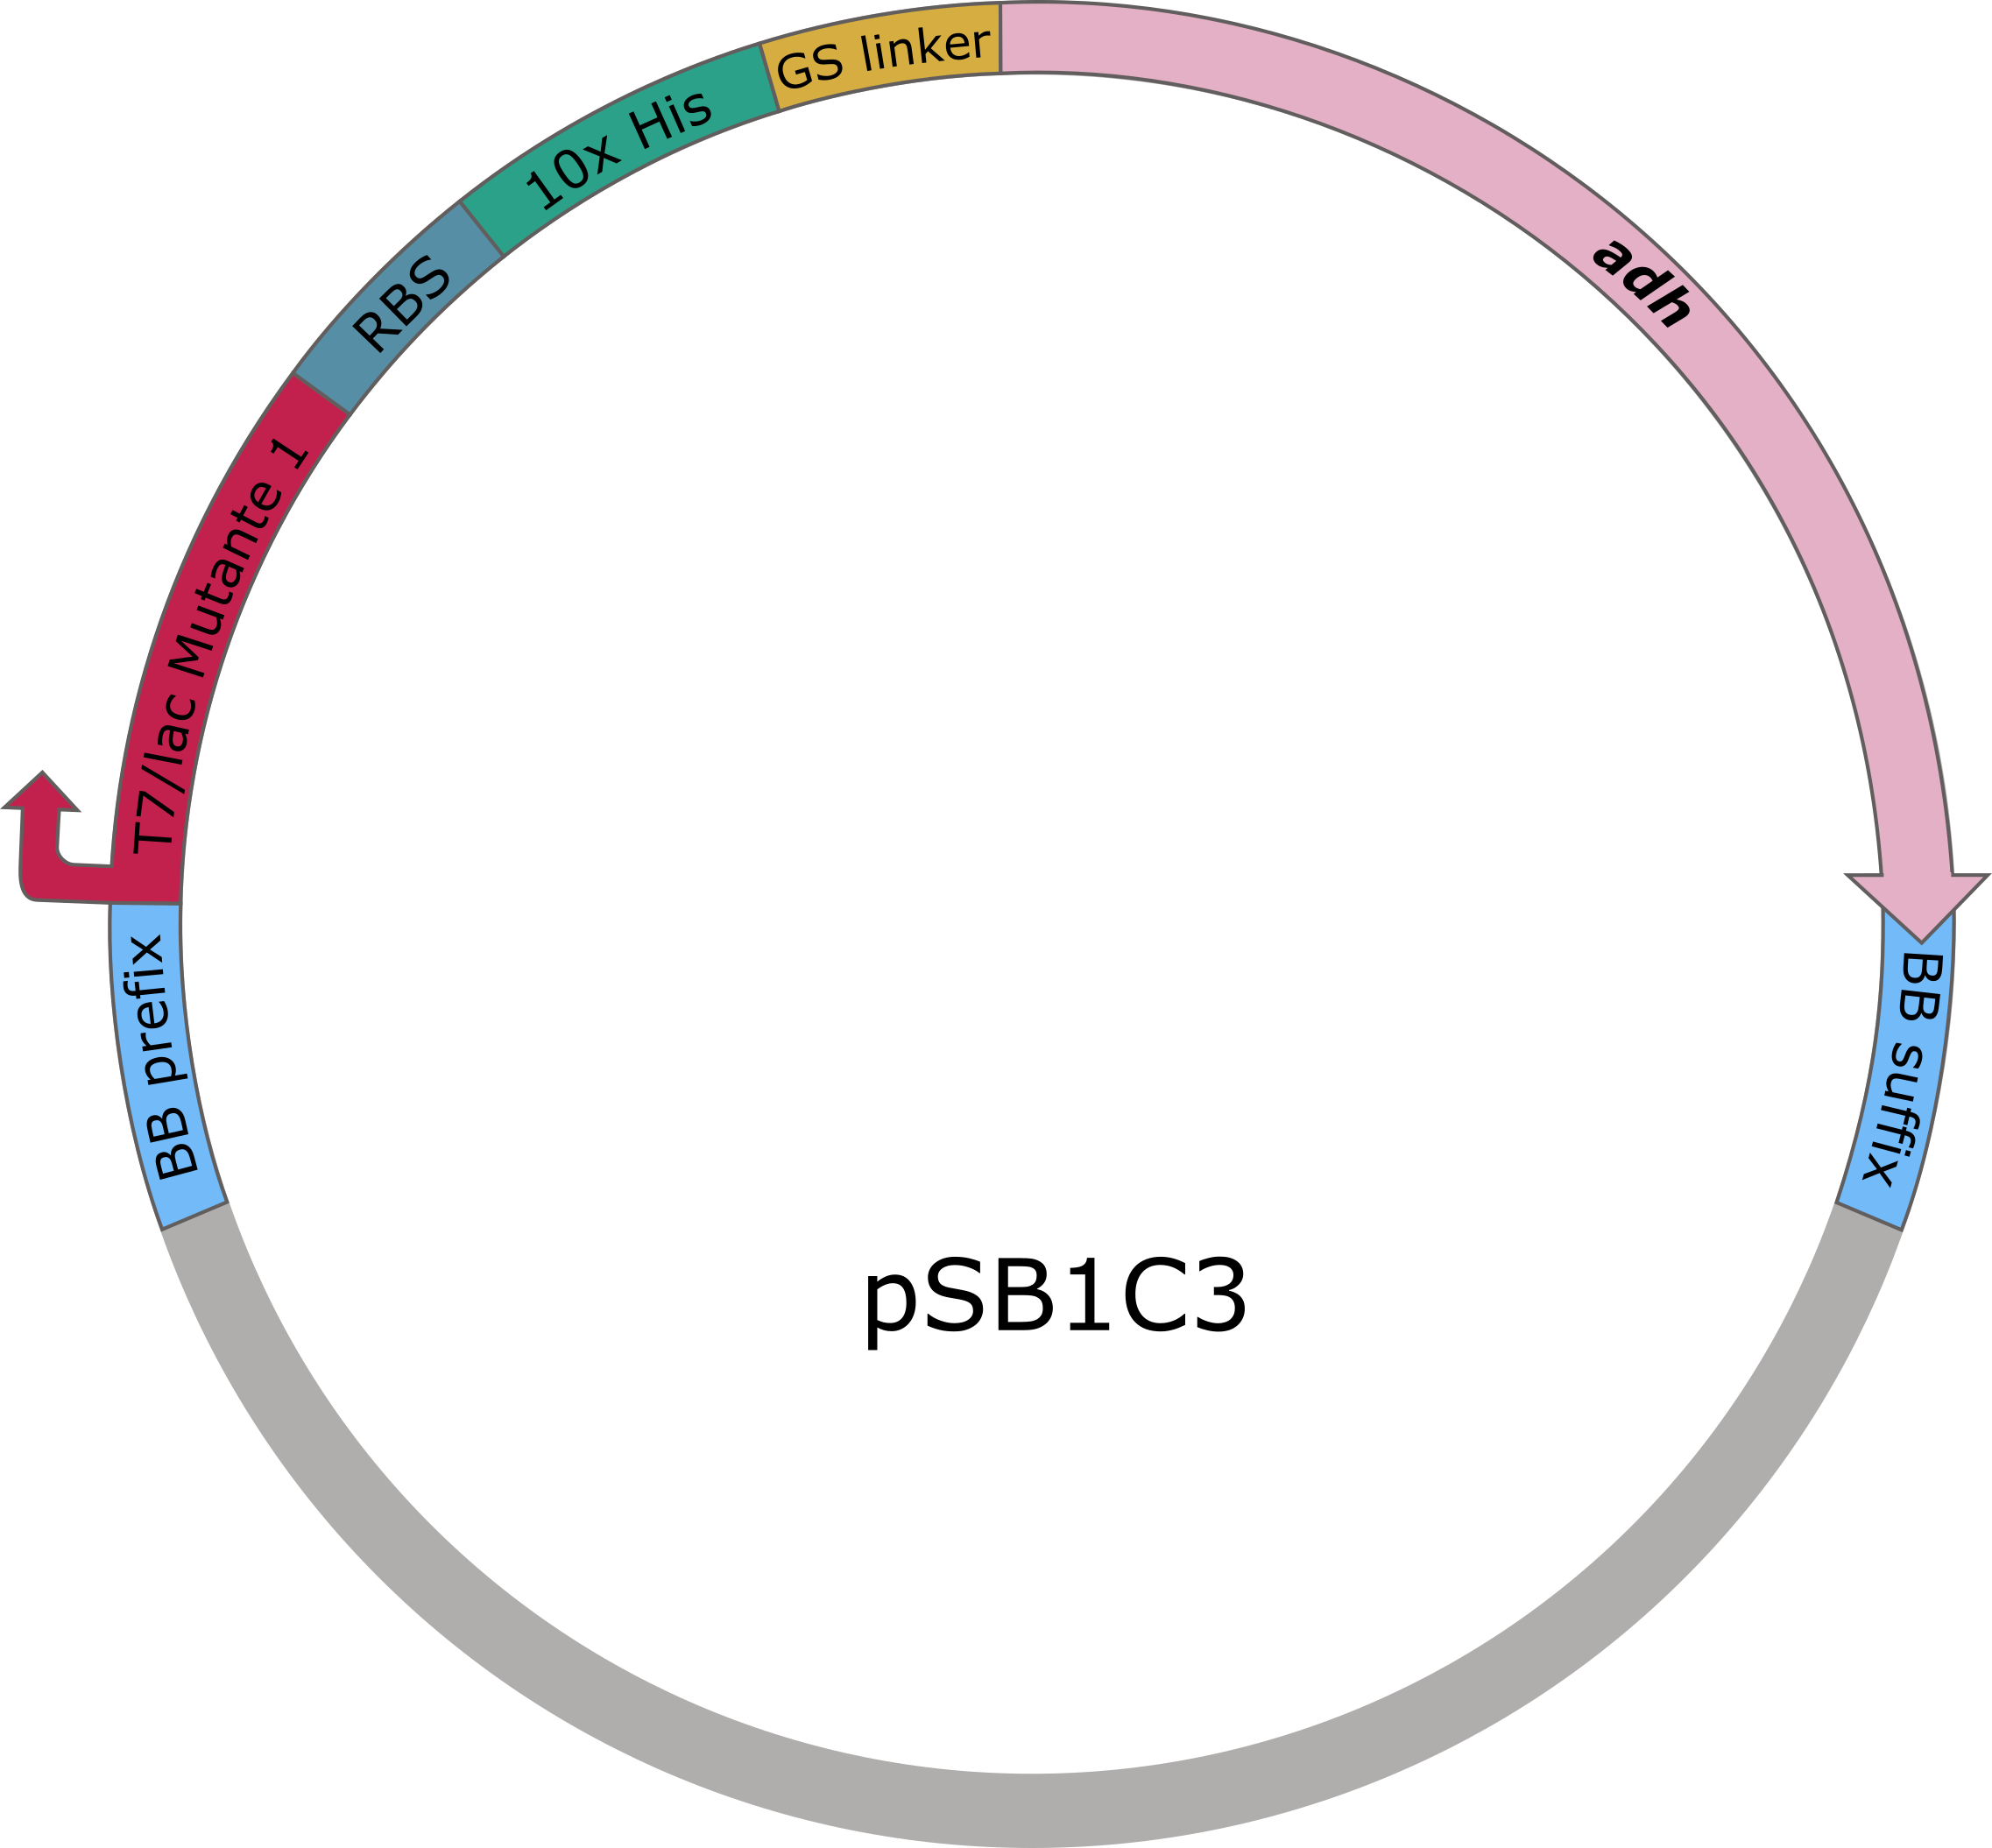
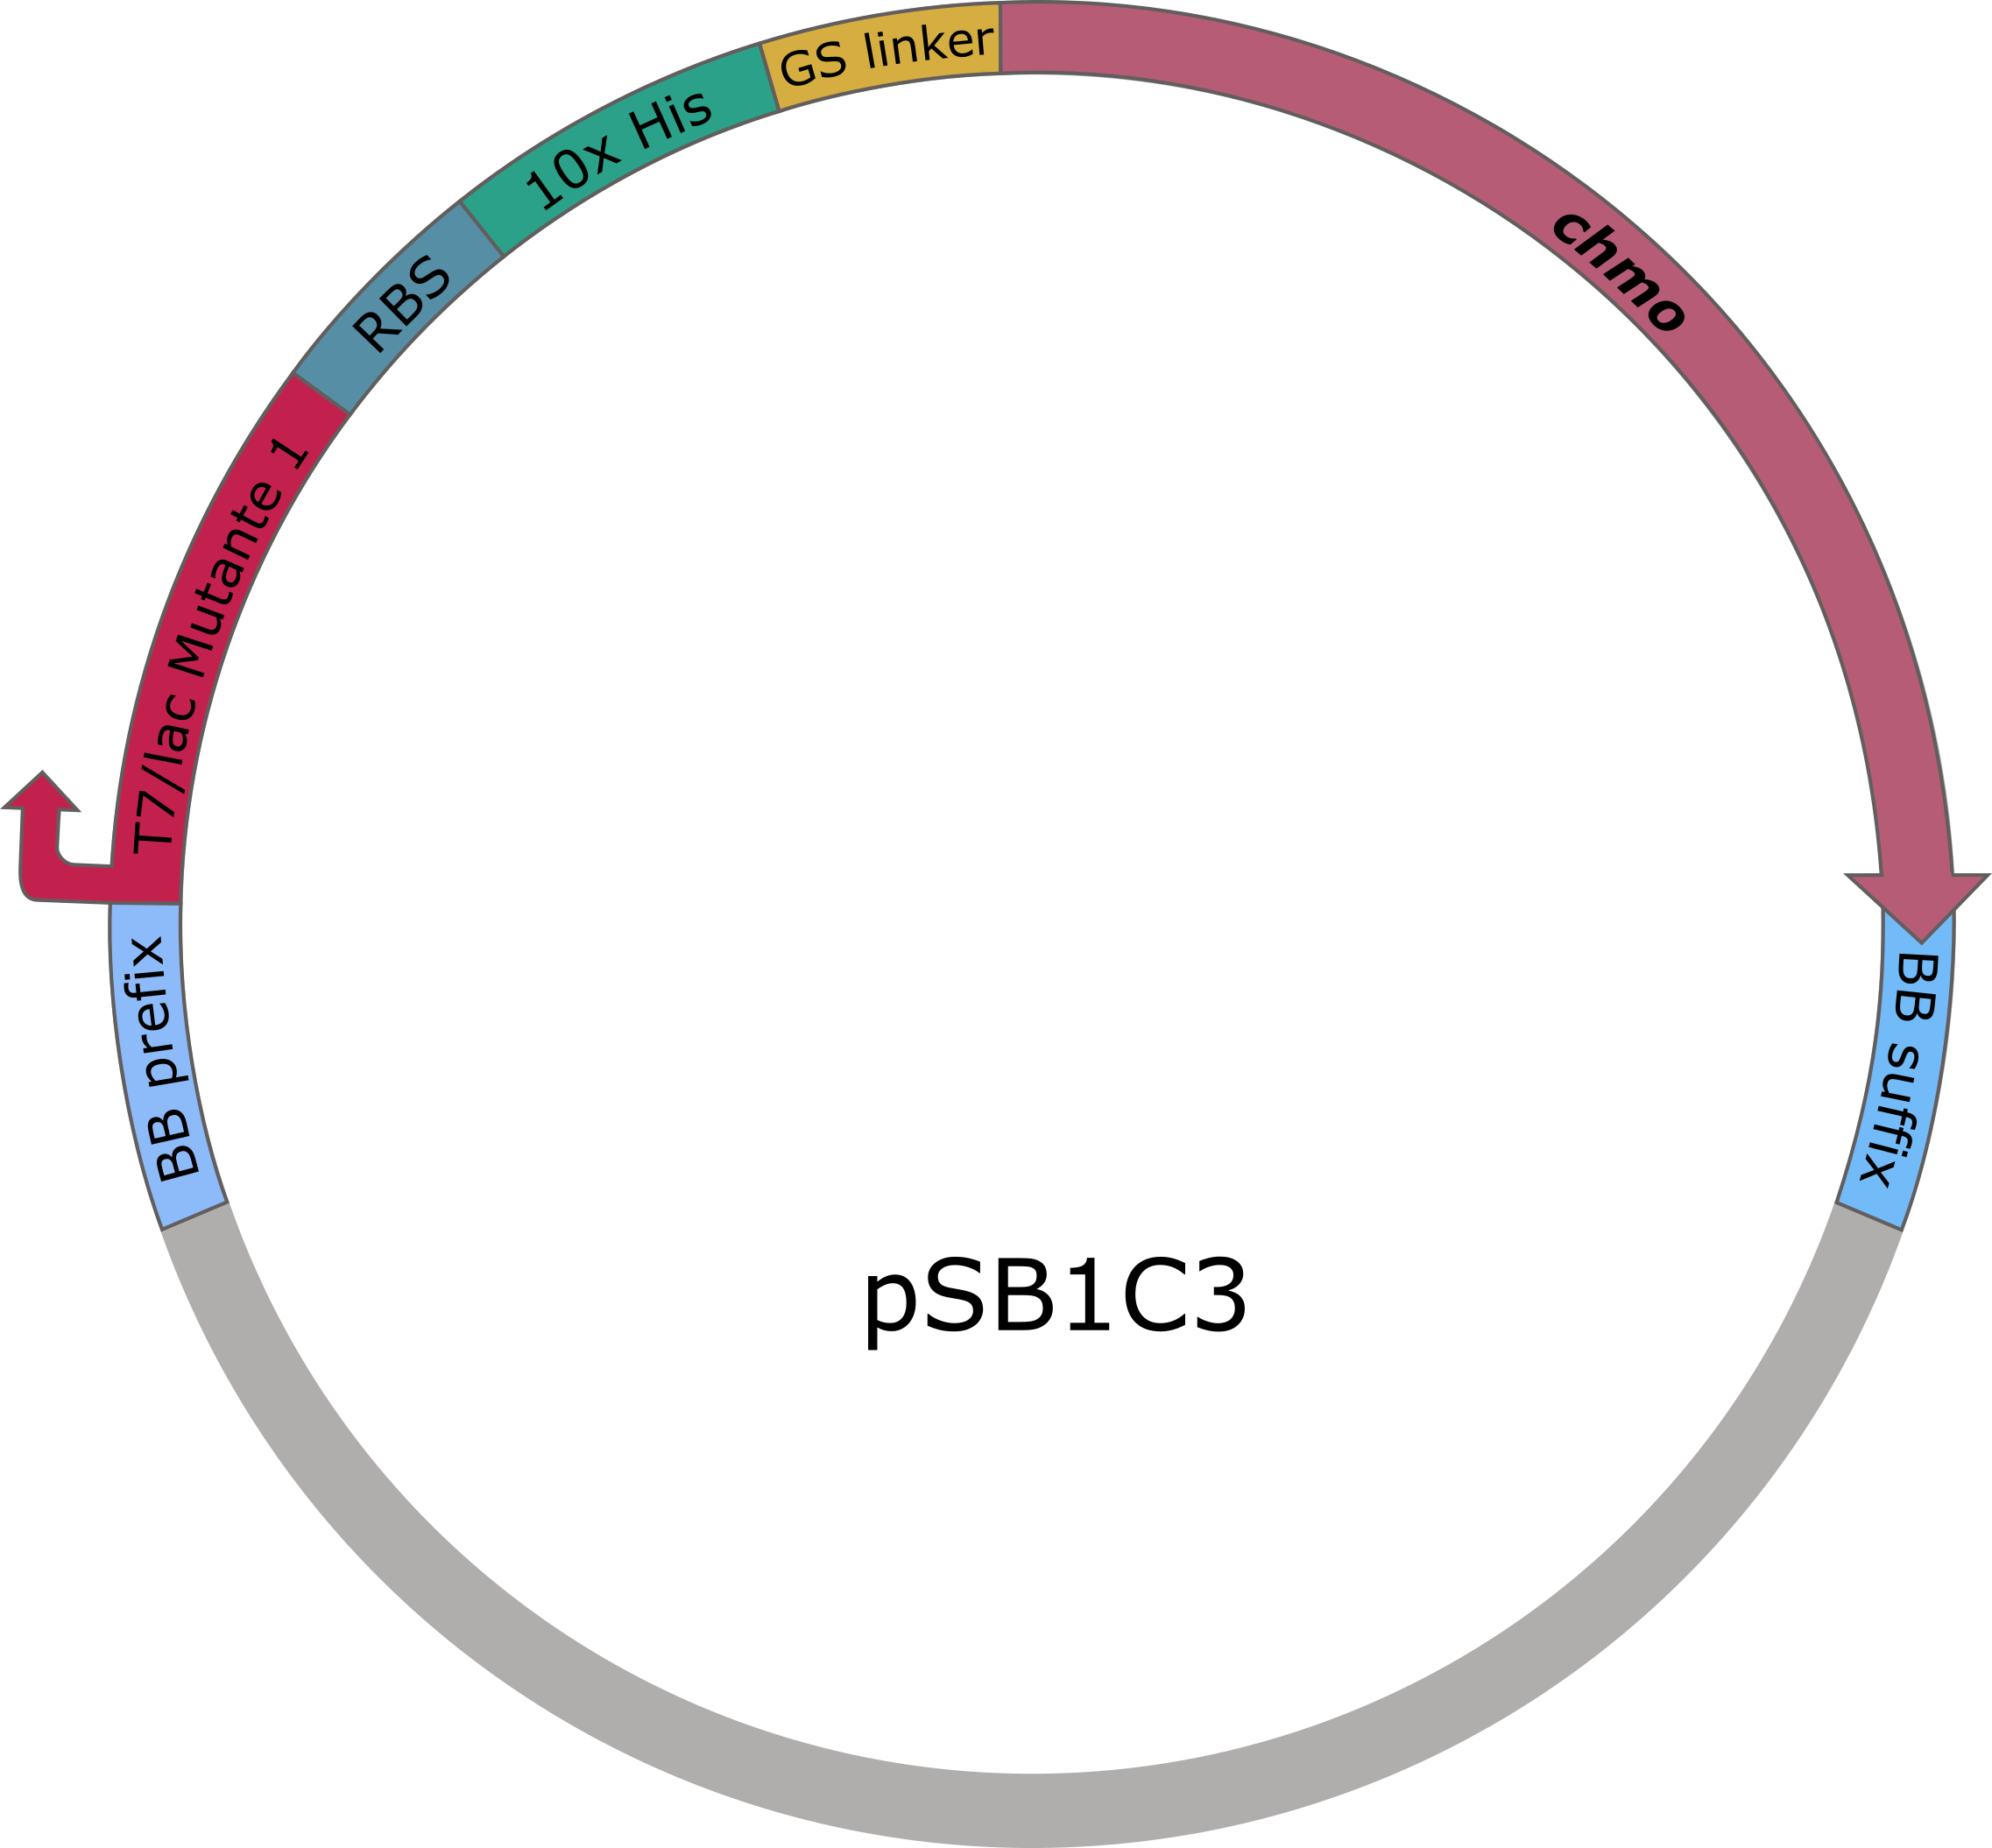
The sequences for adh and chmo, with the two named mutations, were modified with a His-tag, ordered from Integrated DNA Technologies (IDT) and inserted into the pSB1C3 plasmid. For this purpose, the BioBrick assembly (BBa) was used. A T7 lac promotor (BBa_K921000) and a B0034-based ribosomal binding site (BBa_K2380024) were inserted upstream of the coding sequence via the BBa as well. E. coli TOP10 were transformed with generated plasmids and positive colonies were identified via colony PCR and DNA sequencing.
Figure 5 (left): pSB1C3 plasmid including expression cassette of adh.
Figure 6 (right): pSB1C3 plasmid including expression cassette of chmo.
SDS-PAGE and Western Blot
To verify that ADH and CHMO were heterologously produced, a SDS-PAGE and western blot were performed. The resulting bands were compared to the molecular weight of ADH and CHMO.
Purification
After expression of adh and chmo in E. coli BL21 by induction of the T7 lac promotor with IPTG, an ÄKTA chromatography system (GE Healthcare, Illinois, USA) was used to purify the desired His-tagged enzymes.
Enzyme Assays
Enzyme activity was measured by following the formation or depletion of NADPH at 340 nm. When CHMO is active NADPH is being depleted while when ADH is active NADP+ gets converted into NADPH. For testing the CHMO and ADH, thioanisole or cyclohexanole was used as a substrate, respectively[3]. The changes in absorption over time were used to calculate the specific enzyme activity utilizing a calibration curve of NADPH. When testing the enzymes together equal amounts of each enzyme were used and cyclohexanol was added as a substrate.
Growth Assay
The aim of the growth assay is to find out in what way the cloned plasmids and the enzyme production affects the growth efficiency of our expression stain E. coli BL21. The tests were performed in a 24 well plade. The OD600 was measured every 10 minutes for a period of 20 hours at 37 °C.
M9 Minimal Medium
The growth of E. coli BL21 was studied in M9 minimal media with and without a supplemented carbon source. M9 minimal medium consists of numerous salts to achieve an isotonic environment, but no carbon source. Hence, bacterial growth in M9 minimal media is inhibited. However, by supplementing either glucose, cyclohexanon or ε-caprolactone in M9 media, the potential metabolization of these compounds of interest as a carbon source can be investigated. Therefore, the OD600 of E. coli cultures with the different carbon sources of interest were measured for 14 hours at 37 °C using a Tecan Spark.
Results and Discussion
Cloning
After ligating adh into the pSB1C3 vector through BioBrick assembly (BBa)[4], a cPCR was performed using VF2 and VR primers. The PCR products (1197 bp and 1996 bp) were successfully detected after running the samples on an agarose gel. The ligation of adh (756 bp) and chmo (1629 bp) into pSB1C3 was also verified via DNA sequencing.
SDS-PAGE and Western Blot
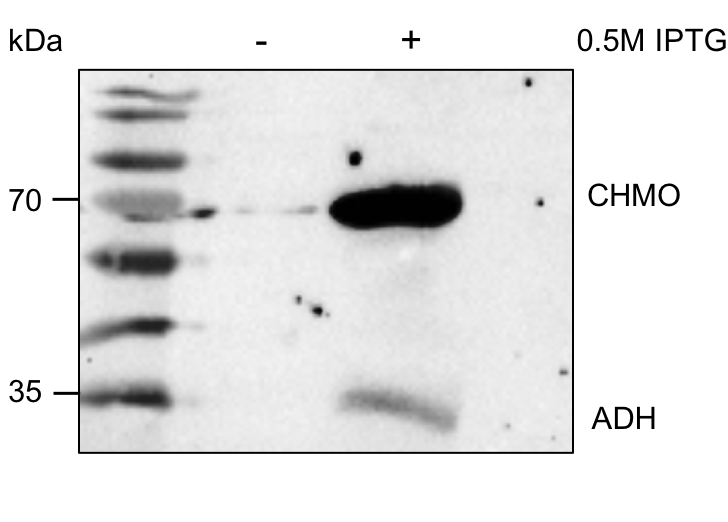
The enzymes ADH and CHMO could not be detected using SDS-PAGE or western analysis. A possible reason for this is that the translation was somehow hindered, or the enzymes were degraded before a measurement could be done. Therefore, a different construct was used to determine whether there was a production of both enzymes. E. coli BL21 were transformed with the plasmid pRSFDuet (provided to us by working groupe Prof. Dr. Bornscheuer) encoding the genes of N-terminally His-tagged adh and chmo under the control of a T7 lac promoter. Positive colonies were identified through white-red selection, cultured, and protein expression was induced by addition of IPTG. Samples were taken after 16 hours and separated via SDS-PAGE. We demonstrated successful protein production via western blot (Figure 7). For this, we used primary Rabbit anti His-tag antibodies and secondary Mouse anti rabbit antibodies conjugated to a horse radish peroxidase (HRP).
Figure 7: Western blot. Lane 1: Protein prestained Ladder (PageRuler™ Prestained Protein Ladder, 10 to 180 kDa, Thermo Fisher Scientific). Lane 2: Negative control. Lane 3: Overexpressed genes adh and chmo in pRSFDuet in E. coli BL21.
The western blot shows two bands at approximately 60 and 30 kDa, which meet the expected molecular mass of CHMO (62.5 kDa) and ADH (28.5 kDa). There are two conceivable reasons for the different intensities of the bands. First, the ADH possesses an S-Tag, which has a lower affinity towards the anti His-tag antibodies than His-tags. The main reason, however, is the different level of expression for the adh and chmo. The optimal ratio for ε-caprolactone production of the two enzymes is 1:10 (ADH:CHMO), which is why the promotors are adjusted to this ratio by design[5]. Thus, the different strengths of the bands have fulfilled our expectations.
Purification
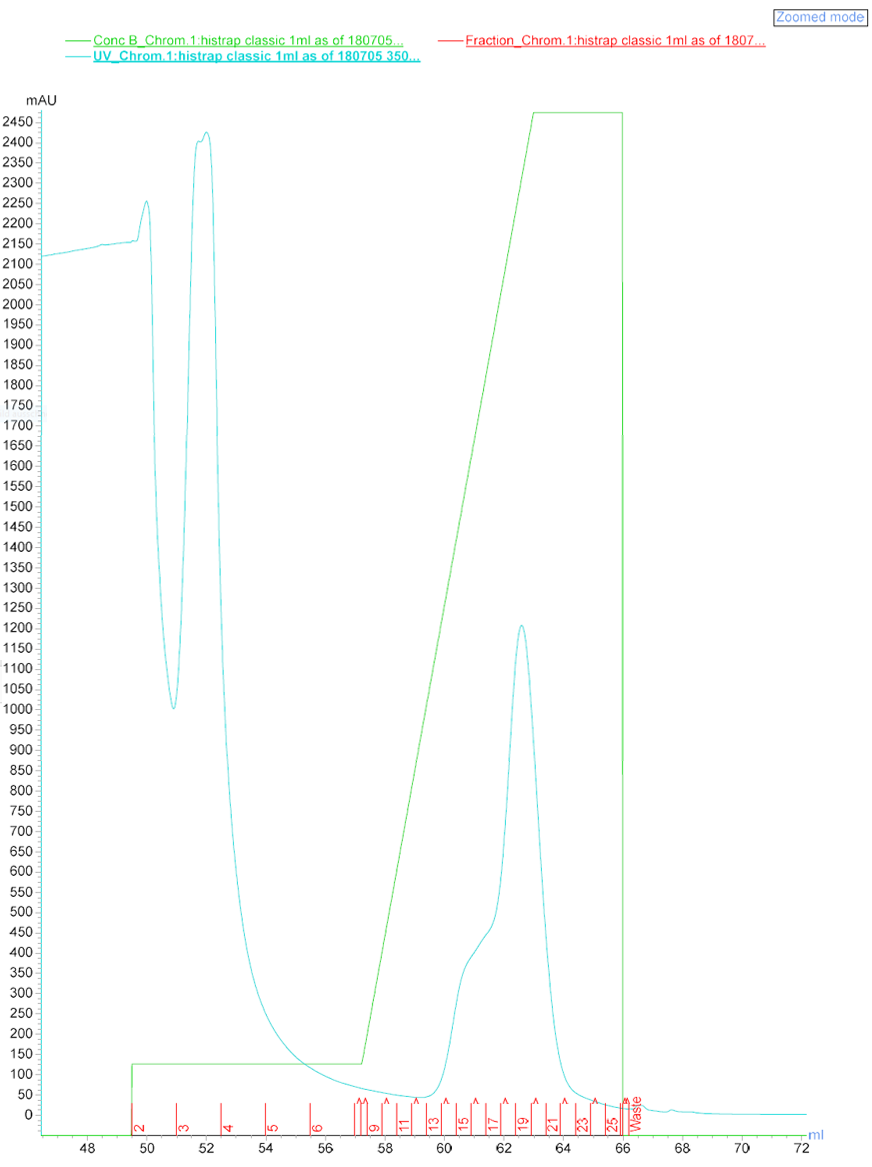
After a successful western analysis of the enzymes on vector pRSFDuet, they were purified using FPLC (Äkta Purifier). There were 3 distinguished peaks detectable in the chromatogram (Figure 8).
Figure 8: Chromatogram of the ÄKTA purification of ADH and CHMO.
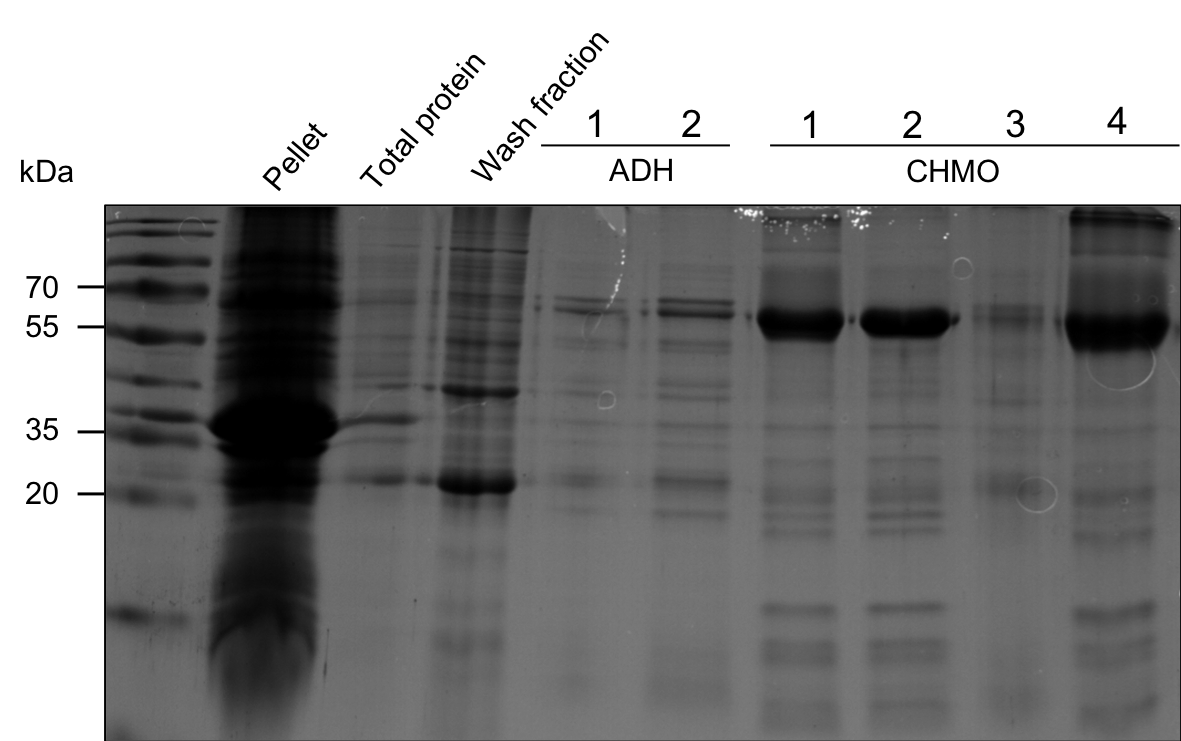
The wash fraction 3 and fractions 13-22 were collected in tubes. ADH was expected to be highly concentrated in fractions 13-16 and CHMO in 17-22. Fraction 3, 13, 14, 17, 19, 20, 21 were analyzed via SDS-PAGE (Figure 9). Also, a sample of the pellet after the cell disruption and a sample of crude protein extract before ÄKTA purification was applied.
Figure 9: SDS-PAGE. Lanes, from left to right: PageRuler Prestained Protein Ladder (10 to 180 kDa), Pellet after disruption, supernatant before ÄKTA purification, fraction 3 (wash fraction), fraction 13 (ADH), fraction 14 (ADH), fraction 17 (CHMO), fraction 19 (CHMO), fraction 20 (CHMO), fraction 21 (CHMO).
The SDS-PAGE shows, that there is a high concentration of CHMO in the chosen samples, but no ADH in the expected fractions. ADH could, however, be collected in the wash fraction. Fraction 3 (wash fraction) was used for later ADH assays and fraction 19 for CHMO assays.
Enzyme Assays
Enzyme activity was measured by following the formation or depletion of NADPH at 340 nm. After mixing either 0.2 or 1 µM of the enzyme with the substrate of choice in the reaction buffer, 300 µM NADP+ or NADPH was added, mixed in a well, and the extinction was measured over time (Tecan Infinite M200 PRO). 10 mM cyclohexanol was used as a substrate for ADH activity measurements and 0.5 mM thioanisole was used for CHMO. The changes in absorption over time were used to calculate the specific enzyme activity utilizing a calibration curve of NADPH.
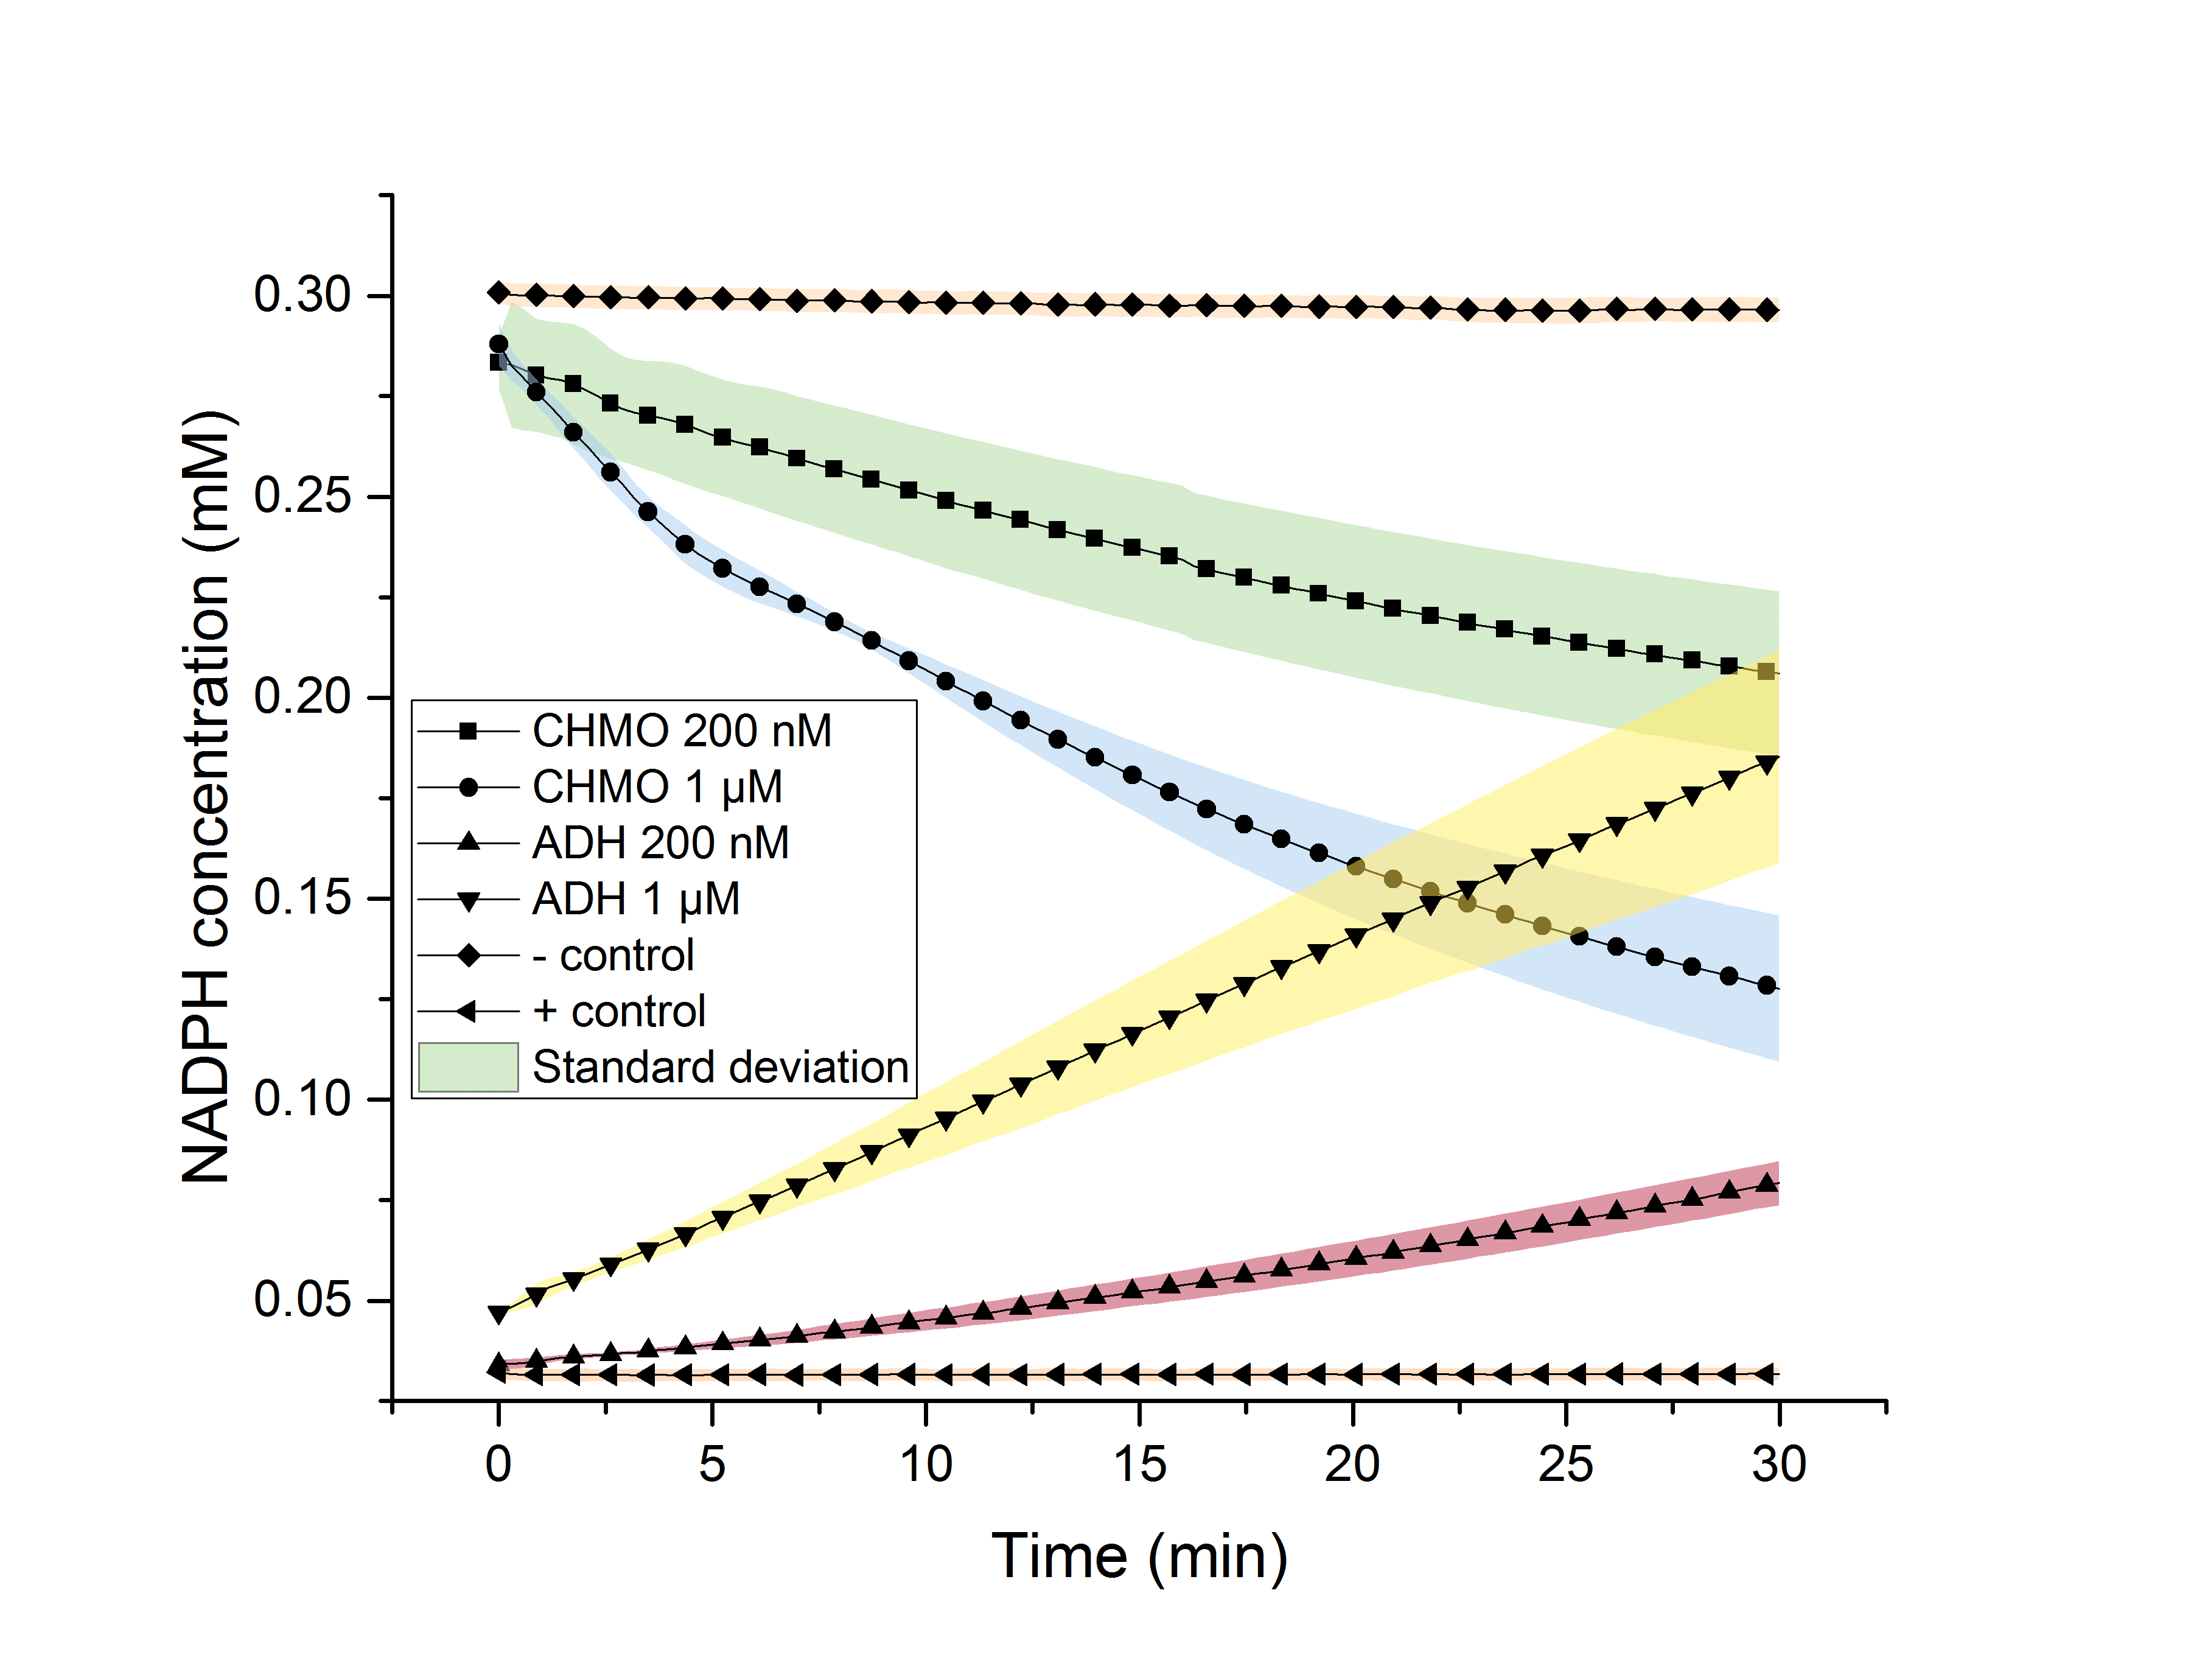
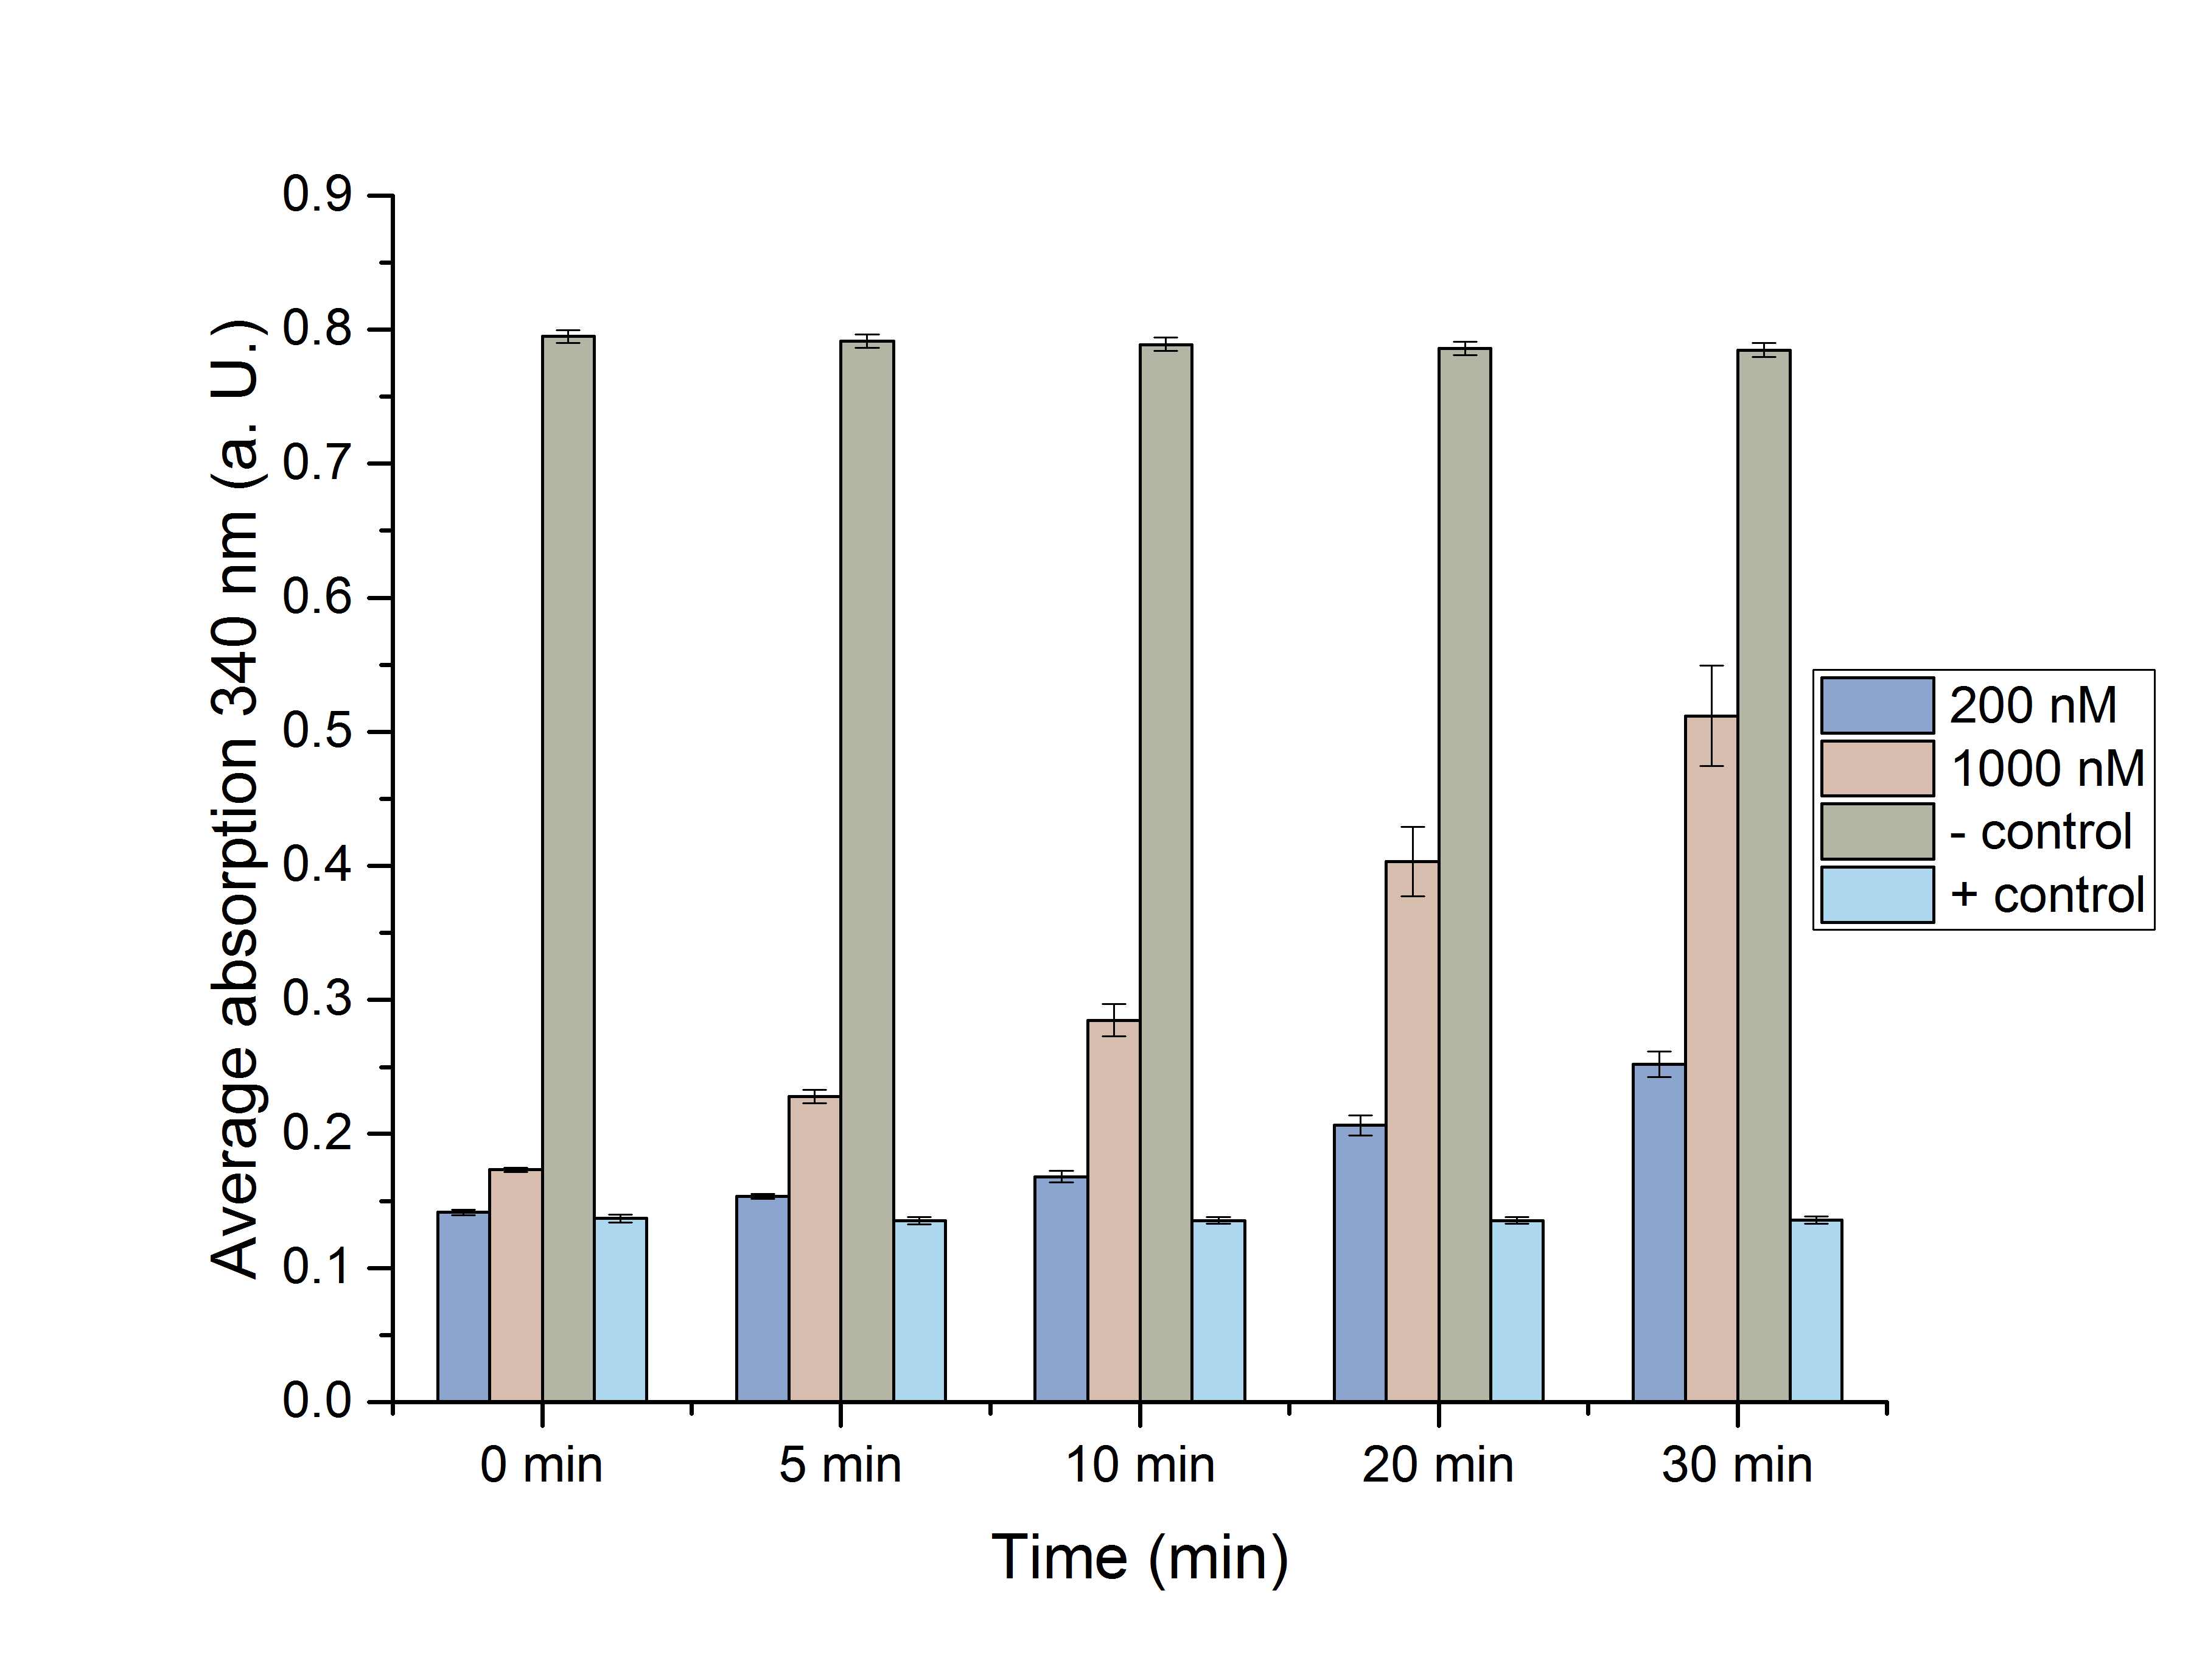
Figure 10: NADPH dependent enzyme assay showing the degradation and formation of NADPH using enzymes CHMO and ADH over 30 minutes.
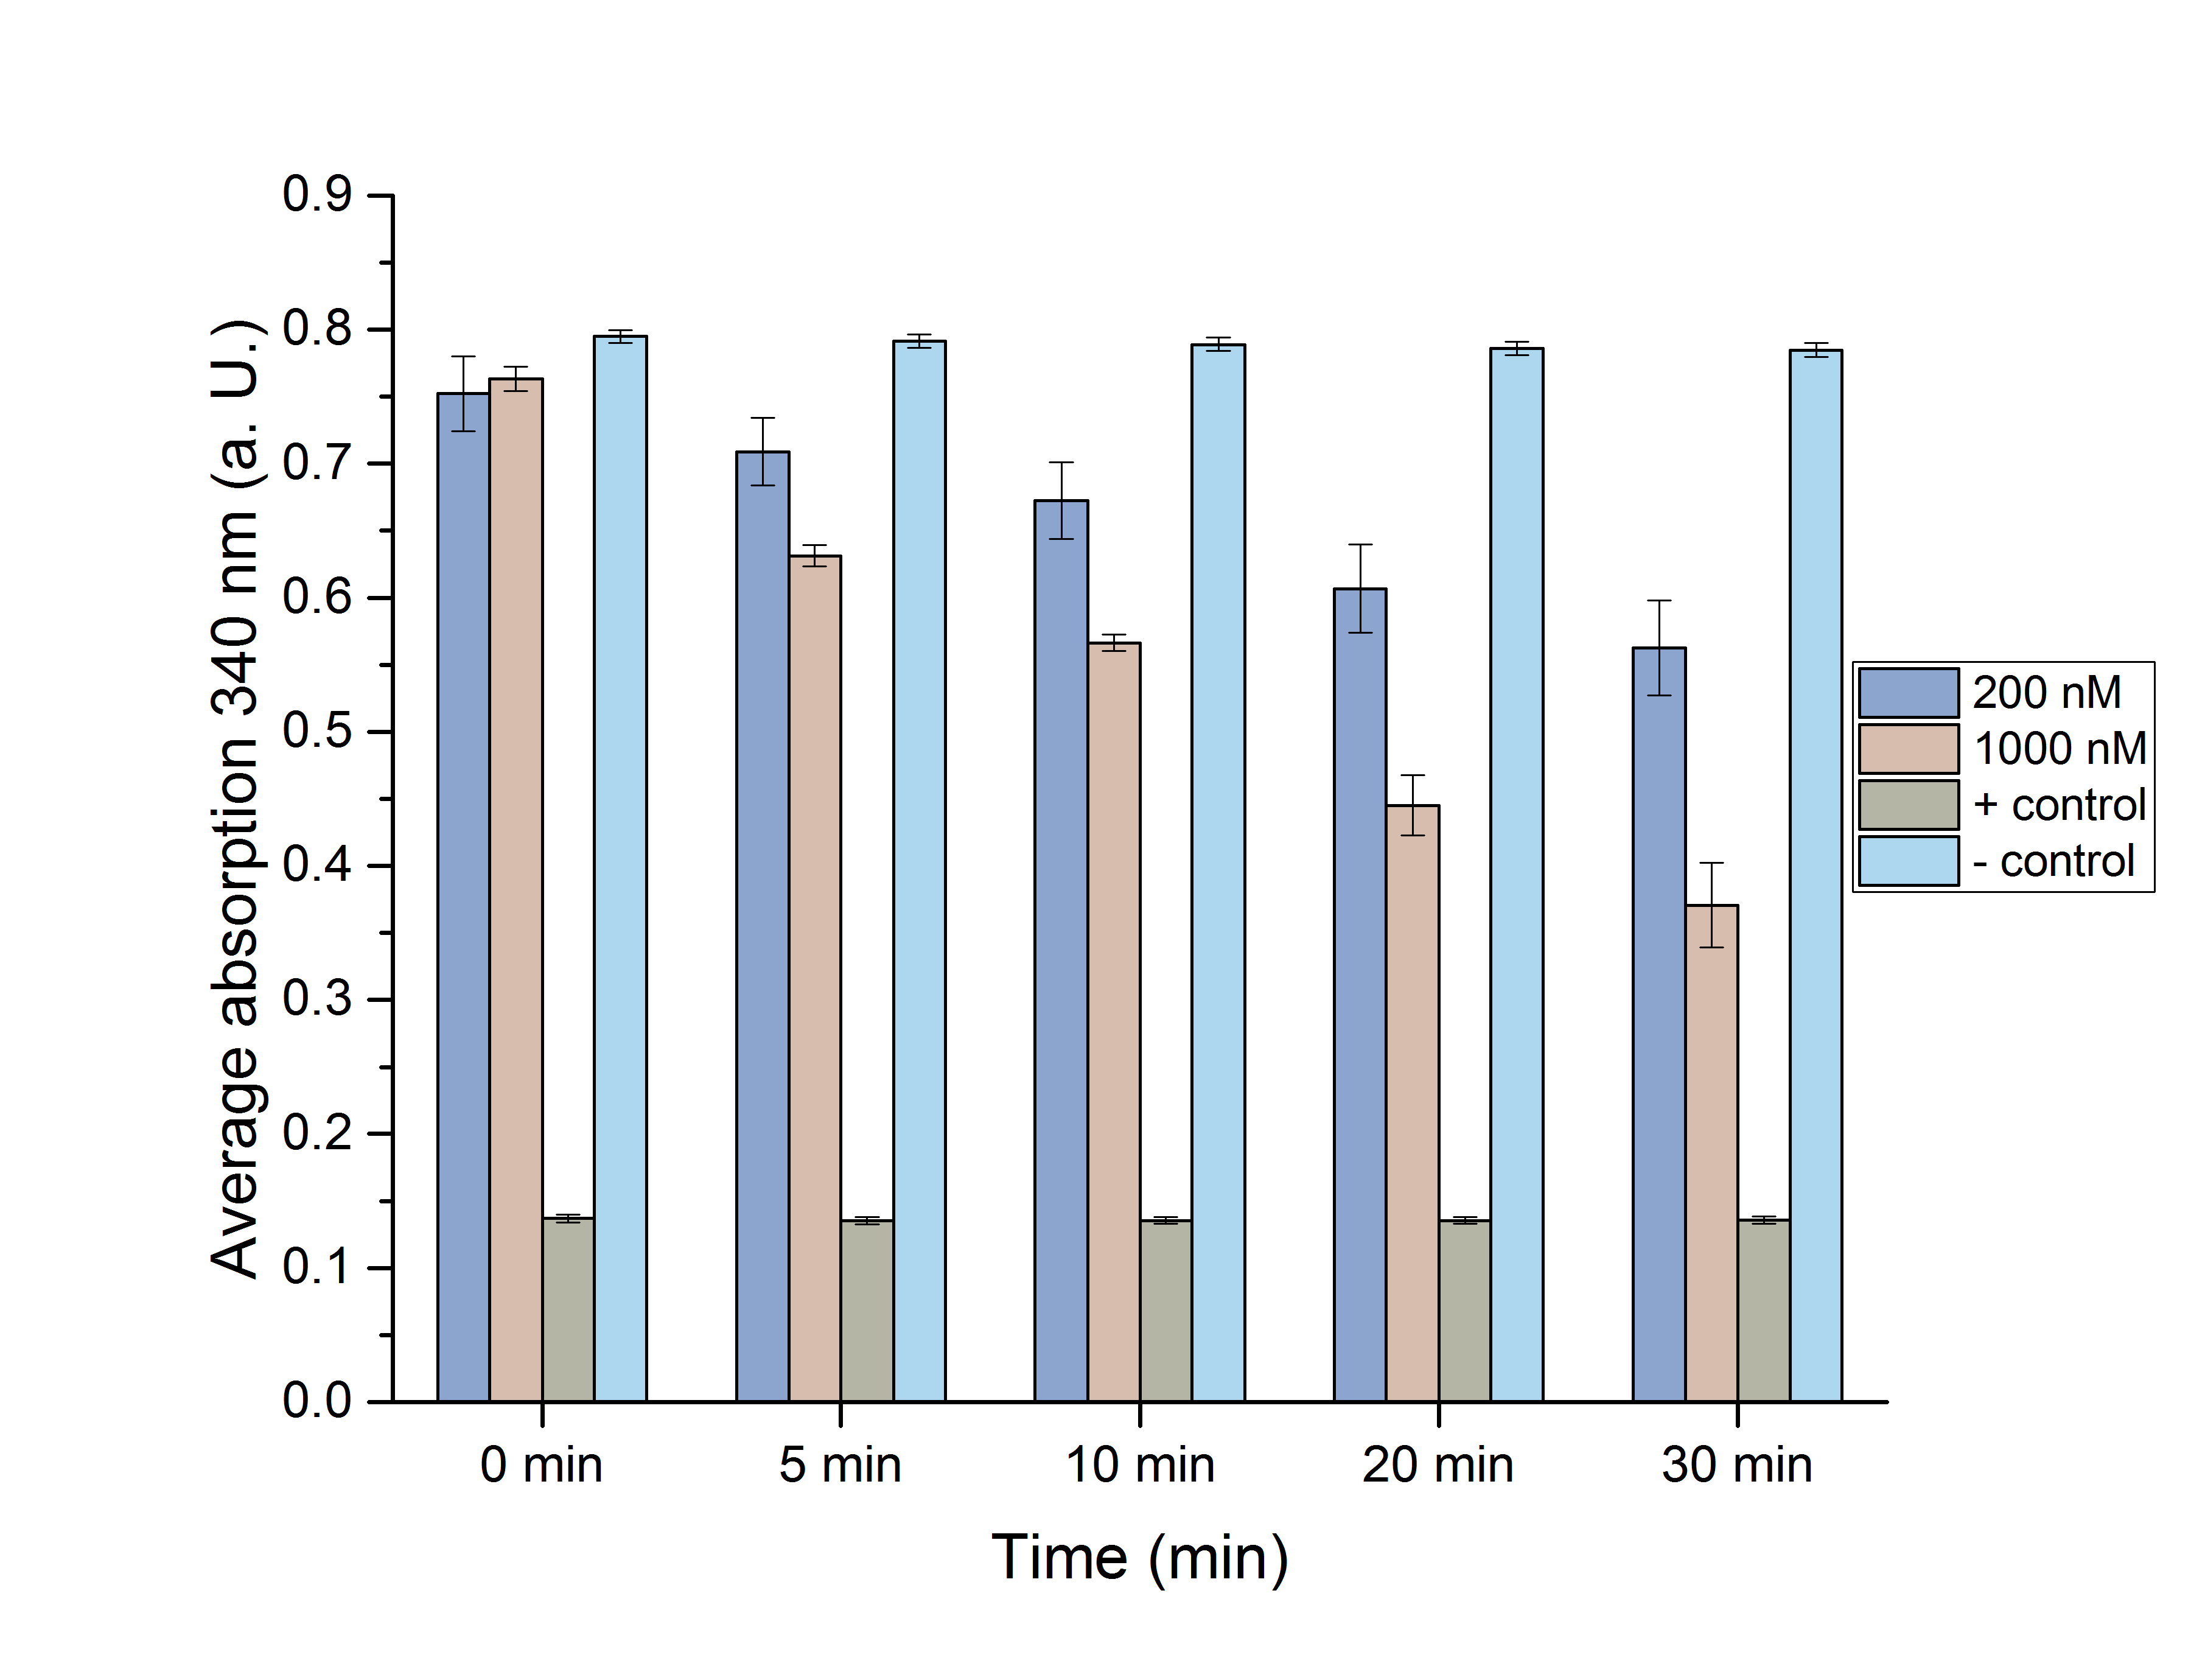
The depletion of NADPH using CHMO and its formation by ADH was observed, individually (Figure 10) 200 nM and 1 µM of the respective enzyme were used for the assays. It is shown, that higher enzyme concentrations result in faster formation/degradation of NADPH. An assay with NADPH/NADP+ without added enzyme was used as a negative/positive control. These controls’ absorption didn’t change over time, indicating an activity of our enzymes. The mean specific enzyme activity (n (product in µmol))/(t (in min)*m (enzyme in mg)) of CHMO and ADH was determined to be 0.17 and 0.22. The assays successfully proofed the activity of our tested enzymes. Future experiments could determine optimal temperature and pH environments for the highest activity. The significance of these assays was determined using the Student’s t-test for 0 min, 5 min, 10 min, 20 min and 30 min. (Figure 11 and 12)
Figure 11 (left): Students' T-test of the NADPH dependent CHMO assay.
Figure 12 (right): Students' T-test of the NADPH dependent ADH assay.
The assays were proven to be significant with a p-value below 0.05, except for 0 min. This could be due to a suboptimal mixing of the components in the reaction-well after this short time.
Next, an assay with both enzymes in one reaction was done, to see, whether an equilibrium of formation and degradation of NADPH could be observed over time (Figure 9).
Figure 13: NADPH dependent assay with ADH and CHMO in one reaction.
For this assay 1 µM of both CHMO and ADH was used, as well as cyclohexanol. As expected, it can be observed, that after a short period of degradation or formation, the NADPH levels are normalized and there is almost no rise of drop of NADPH levels over time, because ADH produces NADPH, and CHMO uses it as a substrate.
Growth Assay
The aim of the growth assay is to find out in what way the cloned plasmids affect the growth efficiency of our expression strain E. coli BL21. For this reasons, different colonies with different vectors cloned inside where tested. E. coli BL21 untransformed was used as a positive control. The gene adh in E. coli BL21 was tested both induced as not induced. The same was done with chmo in E. coli BL21. E. coli BL21 transformed with a vector with both adh and chmo was tested induced and not induced as well.
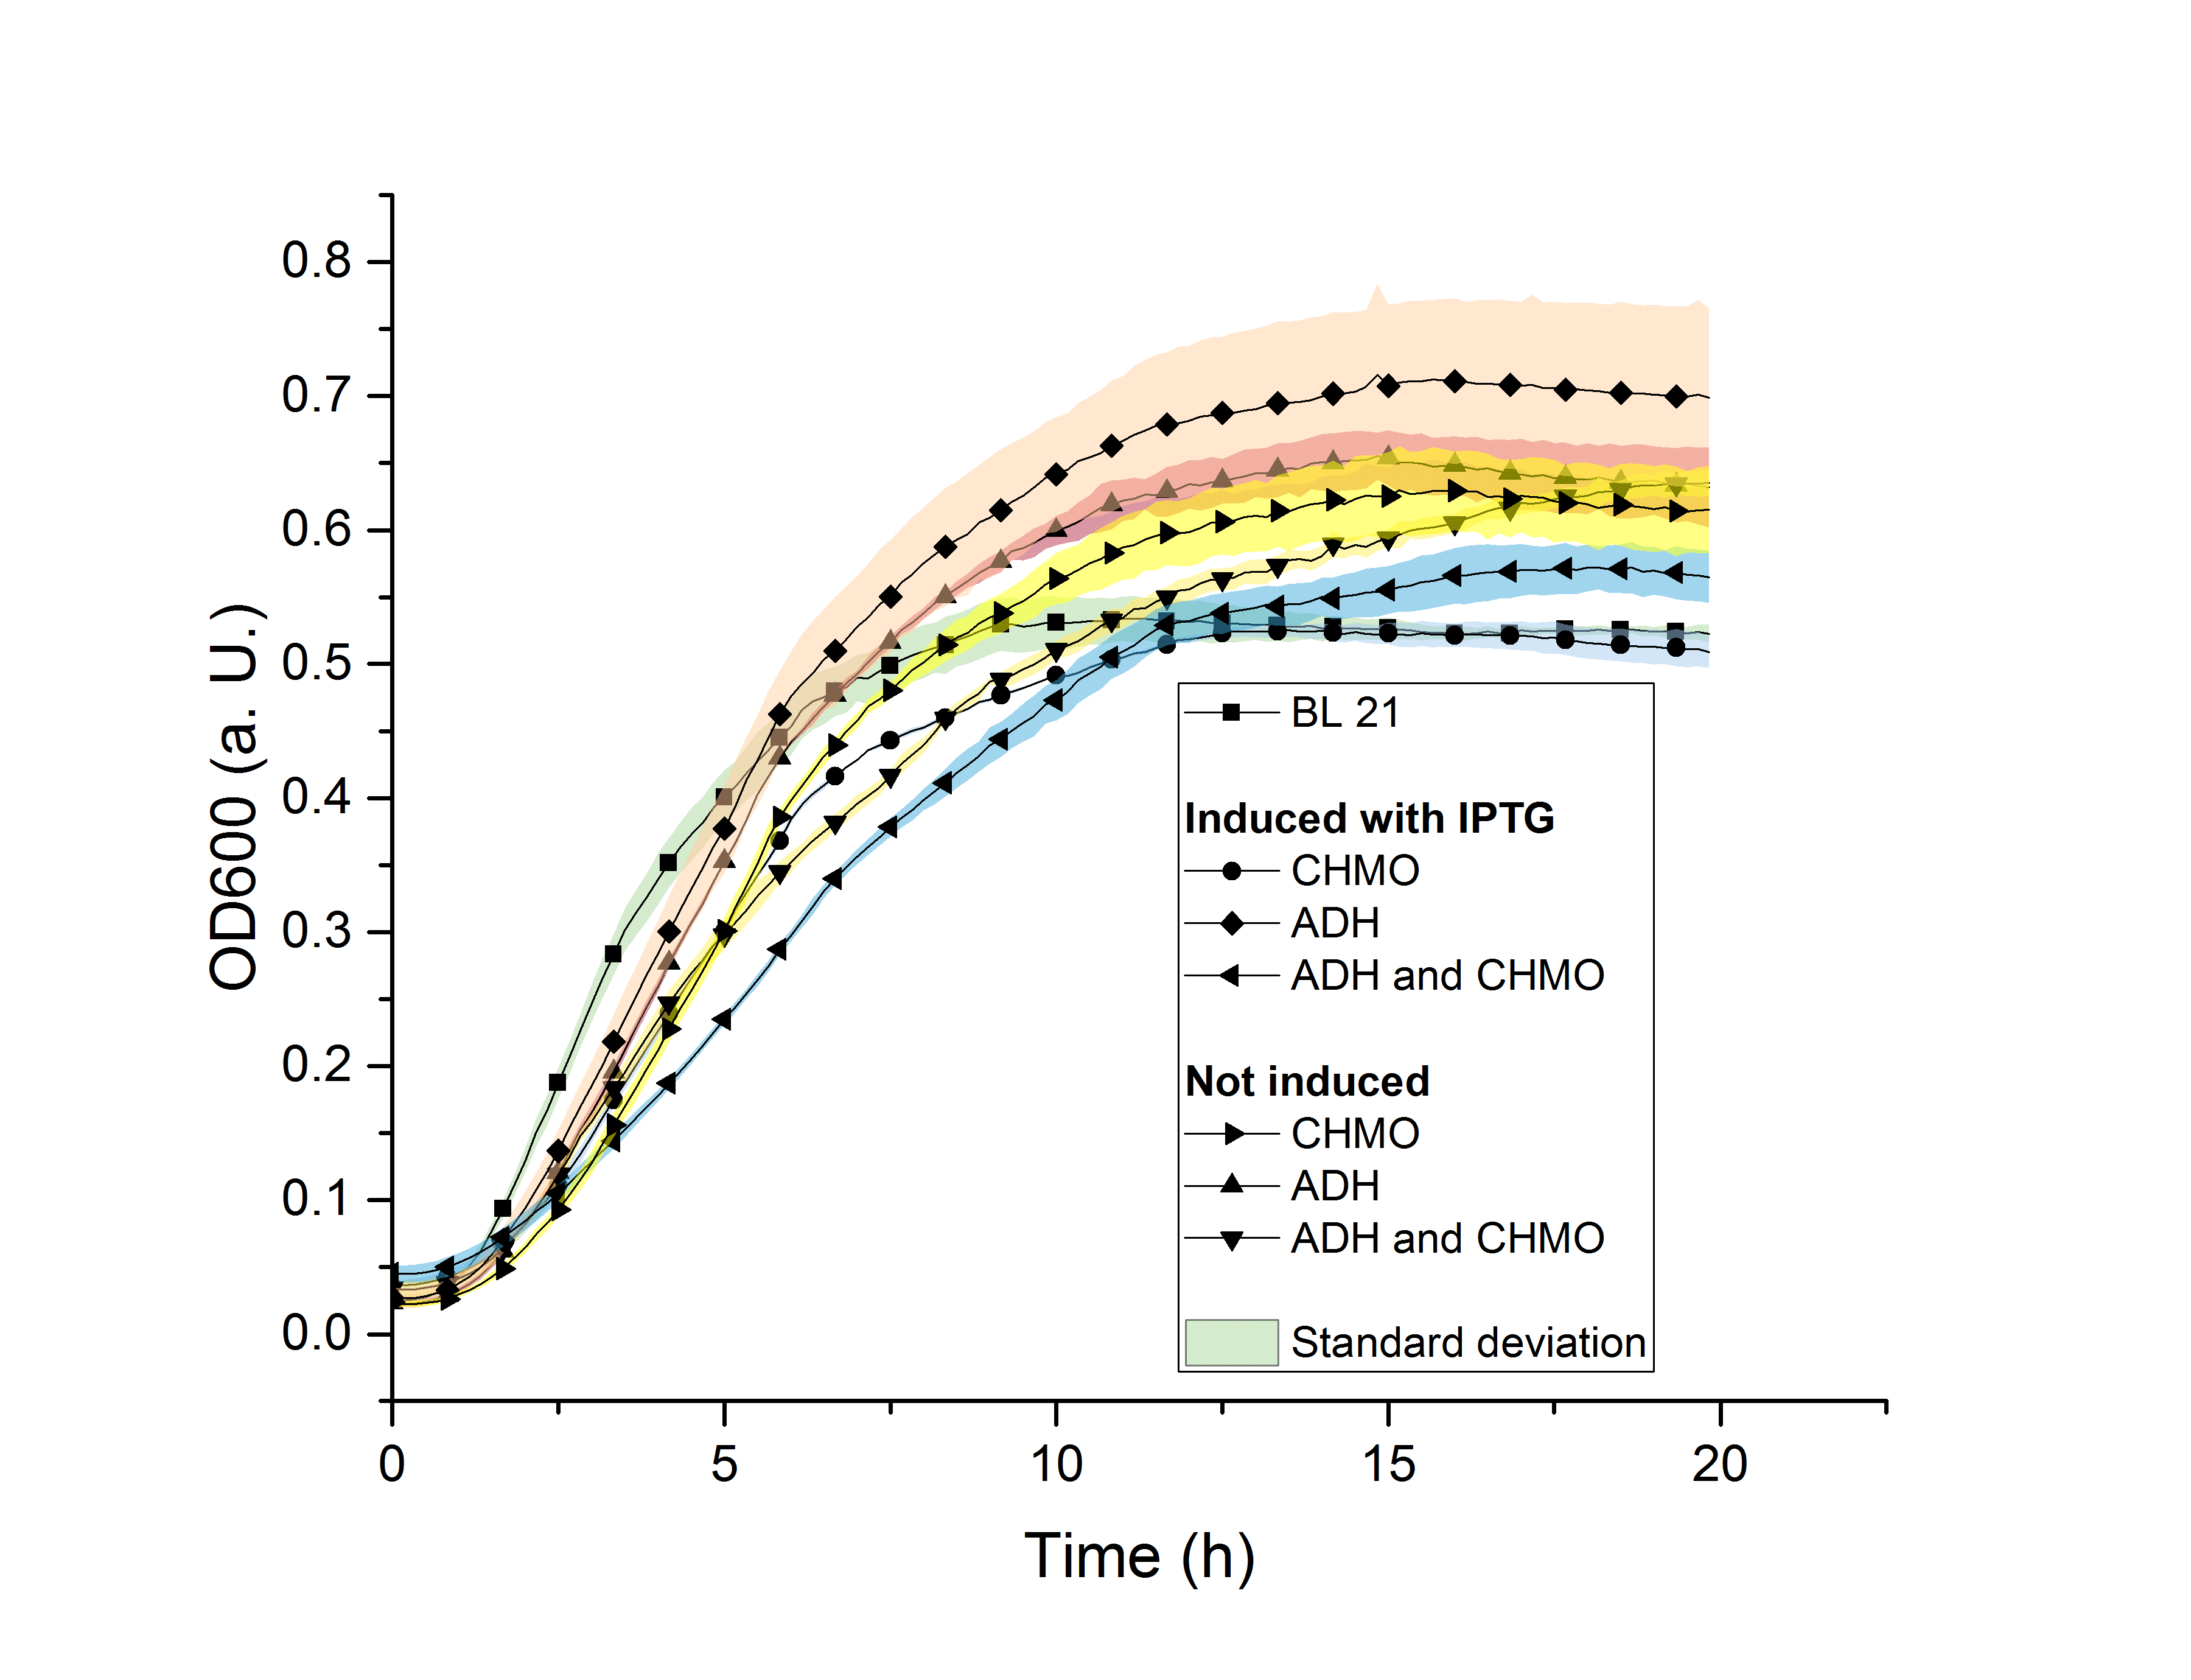
Figure 14: Growth assay with E. coli BL21 with different vectors and induced or not induced.
In figure 14 the results of the growth assay are shown. It can be seen, that the E. coli BL21 colony with the induced adh plasmids grows better than the other colonies including the positive control E. coli BL21 without an added plasmid. It can furthermore be seen that the induced chmo strain and the positive control reach the lowest plateau with an OD600 of 0.5 while the E. coli BL21 with adh induced grows until an OD600 of 0.7. We expected the positive control without an added plasmid and without inducing to grow best since it does not have a metabolic burden added. It was also expected, that the induced E. coli BL21 strain with chmo and adh added has the lowest growth rate due to the large added plasmid and to the two enzymes which take effort to be produced additionally. In the experiment this colony shows an average growth with a final OD600 of 0.55. Possible source of error might be that a mistake occoured when inoculating the LB-media in the well with E. coli BL21. As a conclusion it can still be said that the added plasmid and the protein production do not seem to affect the growth of E. coli BL21 severely. This means for us that our modified E. coli BL21 is still able to grow properly and also produce ε - caprolactone.
M9 Minimal Medium
The goal of the M9 growth assay was, to find out whether our expression strain E. coli BL21 was able to use the produced product and intermediate as a carbon source. In our case, the substrate of the production was cyclohexanol, which is converted into the intermediate product cyclohexanone by ADH, and then into ε-caprolactone by CHMO. It is already known, that cyclohexanol decreases the growth rate of E. coli BL21[6]. For this reason, cyclohexanol has not been tested as a possible carbon source for E. coli BL21.
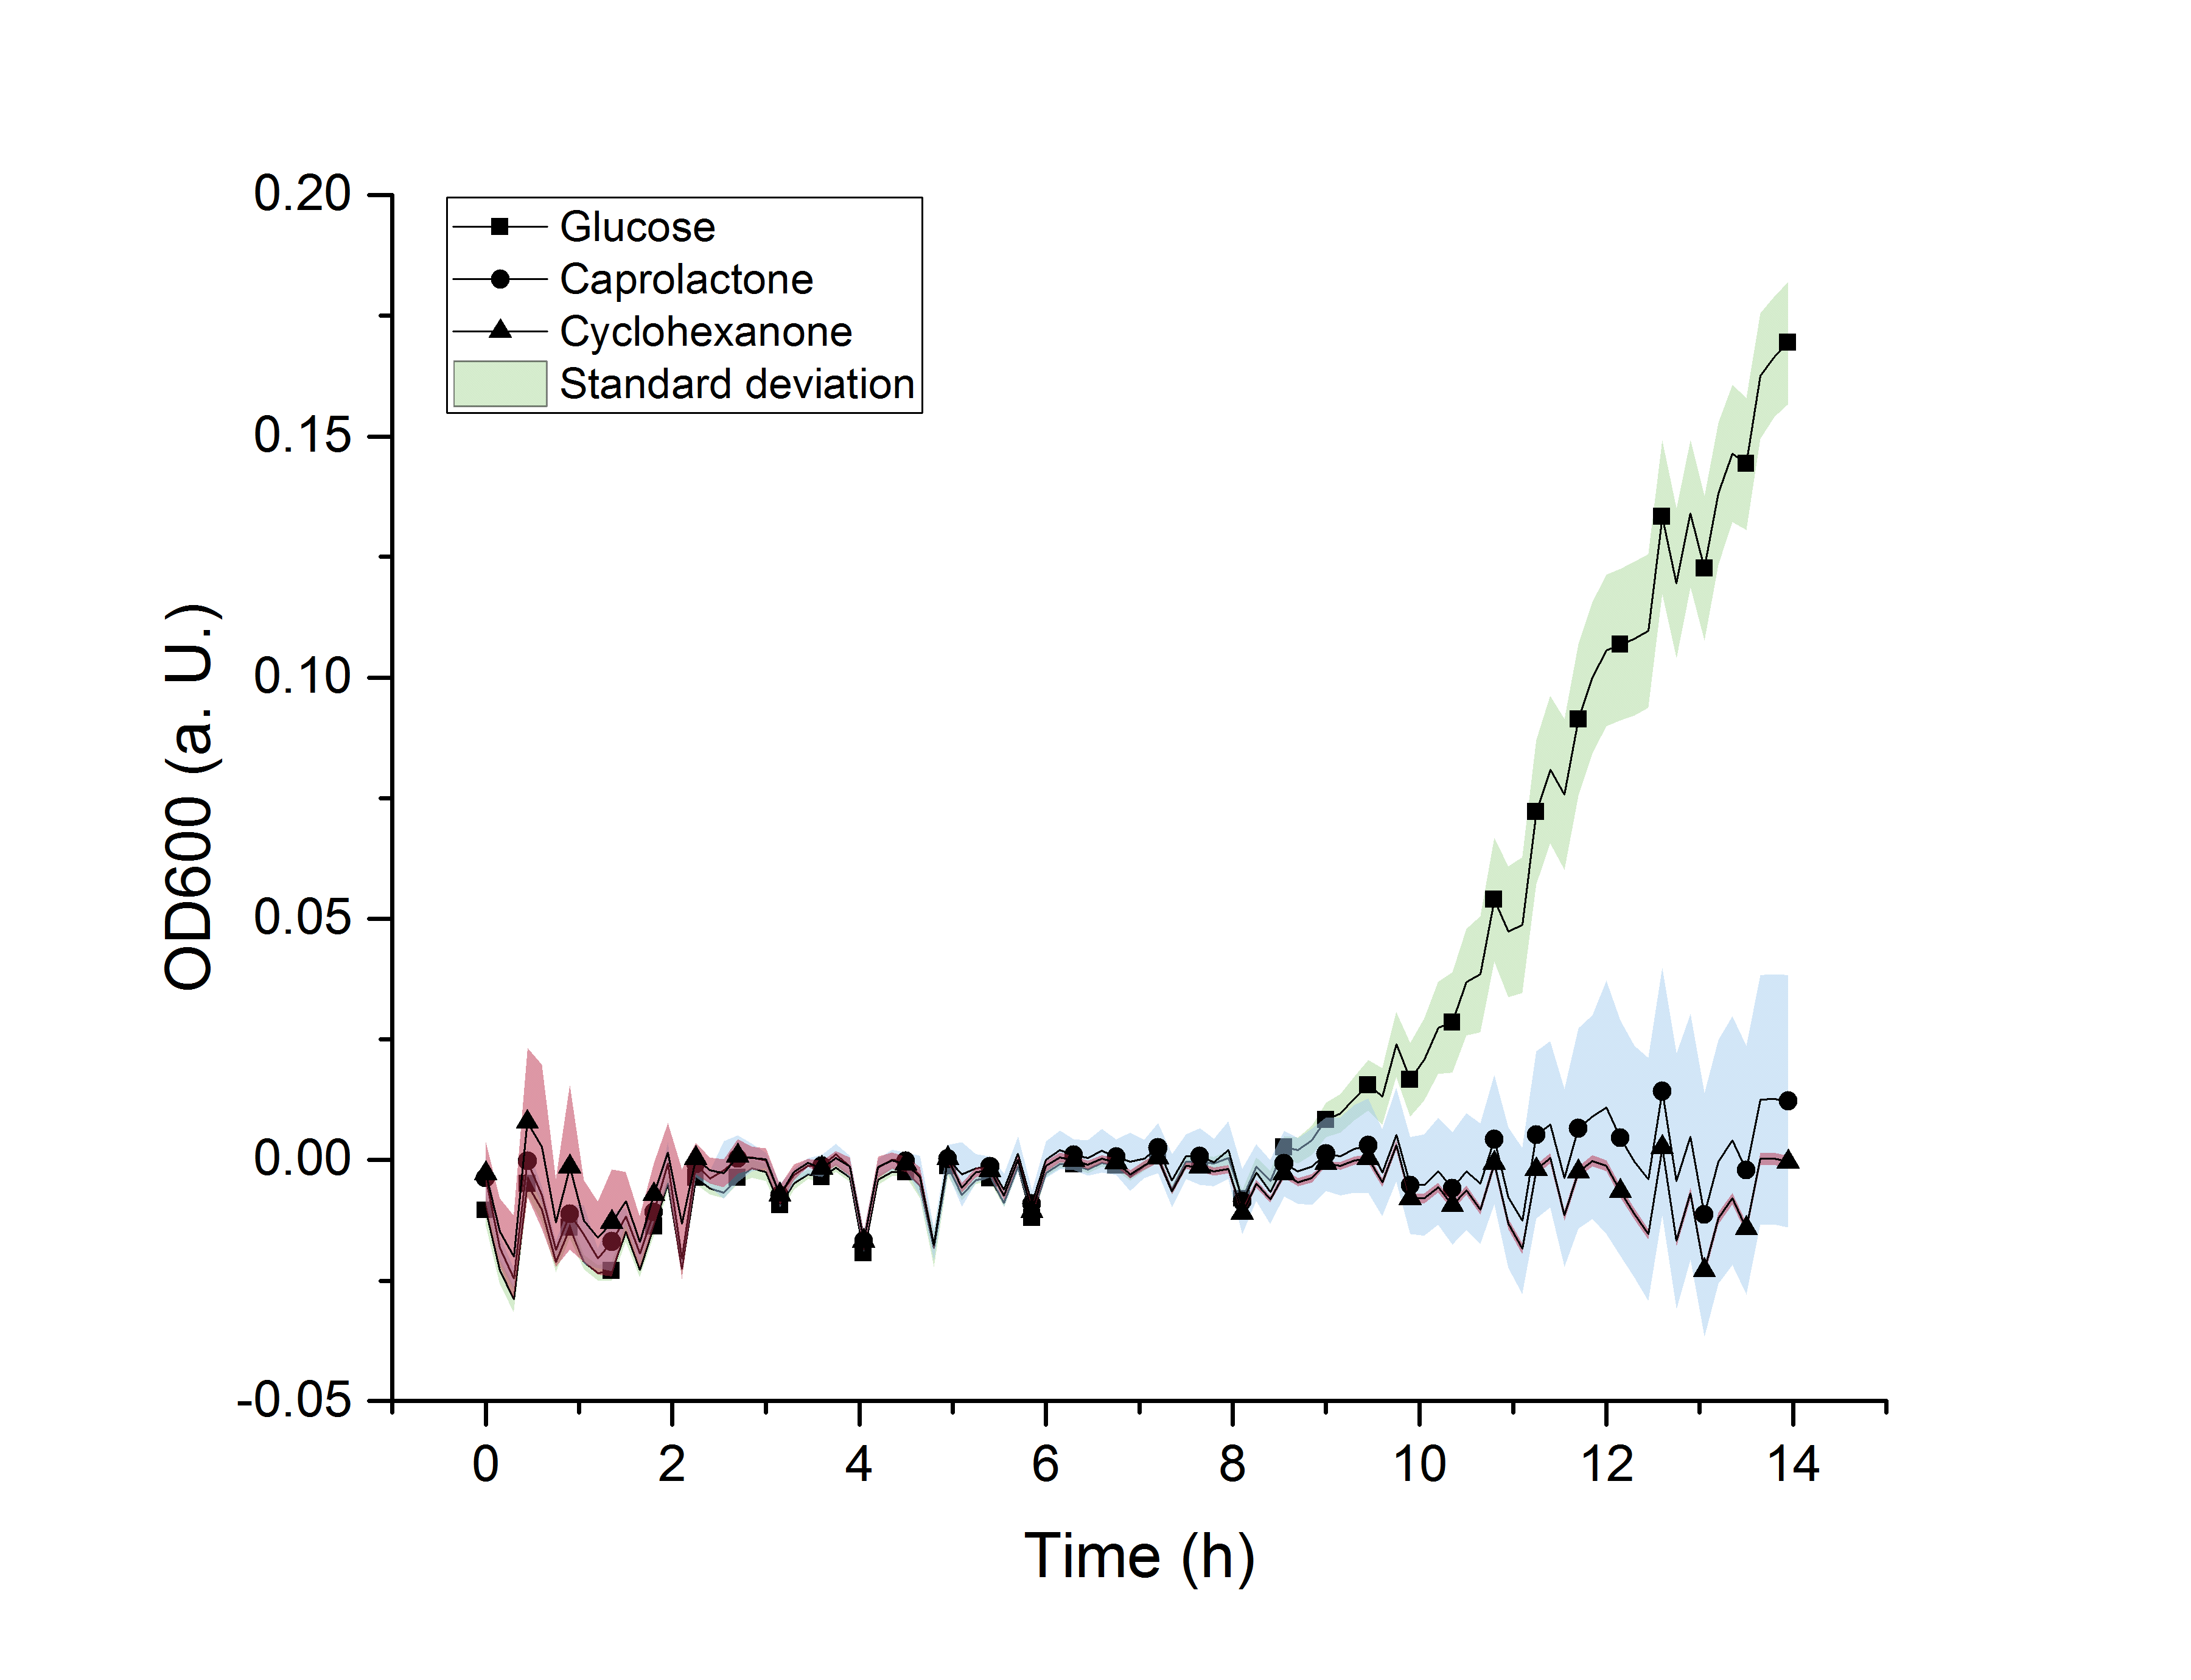
Figure 15: M9 growth assay of E. coli BL21 on M9-minimal media with either glucose, cyclohexanone or caprolactone added as a carbon source.
In figure 15, the absorbance at 600 nm (OD600) was plotted against time in hours. It can be seen, that the OD600 of both the media with caprolactone and with cyclohexanone, respectively, only slightly change and do not increase. At the same time, the OD600 of the minimal medium with glucose increases. The OD600 correlates with the number of cells in the media. As significant cell growth can only be observed in glucose-containing media, we concluded that cyclohexanone and ε-caprolactone are no suitable carbon sources for E. coli BL21. With this knowledge it can be said, that our products and intermediates are not metabolized by E. coli BL21, which makes it a suitable organism for the production of &epsilon-caprolactone in this regard.
Outlook
There are several things we did in our project to enhance the activity of the cyclohexanone monooxygenase (CHMO), which is catalyzing the ε-caprolactone-forming step. First of all, we used the double mutant C376L/M400I of CHMO. This mutation leads to a higher tolerance against molecular oxygen as well as an enhanced stability, which leads to a longer period of ε-caprolactone production. Combining CHMO with the alcohol dehydrogenase (ADH) is another way how we want to upscale the production of ε-caprolactone. CHMO is NADPH-dependent and since NADPH is an expensive chemical, its use in industry processes is economically unfeasible. The function of ADH is to regenerate the NADPH. By adding the enzyme to the organism, it makes the process self-sustaining. The highest product concentration can be reached when using ADH and CHMO in a ratio of 1:10[2]. There are a lot more things which can be done to enhance the product yields from CHMO, which we were unfortunately unable to do because of limited time. One problem of the CHMO is product inhibition. This problem can be faced by additionally adding CAL-A lipase from Candida Antarctica. CAL-A lipase performs an enzymatic ring opening polymerisation of the ε-caprolactone thus creating ε-caprolactone oligomers and can thereby avoid the inhibition which leads to higher yields[2]. Cyclohexanol is the substrate added to enable the reaction to take place. The effectiveness of CHMO can be improved further by adding bacterial haemoglobin from Vitreoscilla stercoraria (Lee et al. 2014). CHMO does not only require NADPH to catalyze the conversion from cyclohexanone into ε-caprolactone but does also need oxygen in order to work efficiently. The haemoglobin is supplying the enzyme with oxygen which leads to a higher yield.
CHMO has the potential to produce high amounts of ε-caprolactone. Especially when the process gets further optimisied, it is worth considering it as an alternative to the chemical production of ε-caprolactone.
Team
Group pictures of the "Capri" team
Left picture: Jana Anton and Sergei Senger
Right picture: Sergei Senger, Leon Schröder, Levin Hafa and Jana Anton
References
- ↑ Diederik J. Opperman,The Royal Society of Chemistry 2015, 2015.
- ↑ 2.0 2.1 2.2 2.3 Sandy Schmidt, Angewandte Chemie, Wiley Online Library, 2015.
- ↑ Friso S. Aalbers, Appl Microbiol Biotechnol, 2017.
- ↑ Reshma P Shetty Journal of Biological Engineering, 2008.
- ↑ Anna Kohl, Elsevier, 2018.
- ↑ Na-Rae Lee, Biotechnology and Bioprocess Engineering, November 2015, Volume 20, Issue 6, pp 1088–1098 .


