Contents
Glycolic Acid Production in S. cerevisiae
Abstract
For the production of a biodegradable polymer, our goal was to produce glycolic acid as one of the monomers in Saccharomyces cerevisiae. Glycolic acid production from glyoxylate was initiated by the heterologous expression of glyoxylate reductase 1 (AtGLYR1). To increase the yield of glycolic acid, we intervened in the glyoxylate cycle by deleting the malate synthase 1 (MLS1) and the isocitrate dehydrogenase 2 (IDP2)[1]. We produced AtGLYR1 in S. cerevisiae, used western blots for verification, purified it via Strep-tag affinity chromatography and characterized its activity through an NADPH assay.
Introduction
By modifying the natural glyoxylate cycle, we aim to generate a biosynthetic pathway to produce glycolic acid in S. cerevisiae using the strains CEN.PK-1C and H3847[1] (see monomer subpage).
Figure 1: Reaction mechanism of ICL1 and AtGLYR1.
GOR1 is the natural occurring gene in S. cerevisiae, which encodes the enzyme converting glyoxylate into glycolic acid by reducing the aldehyde group in a NADPH-dependent reaction. Since the gene is not expressed[2] under normal growth conditions and the encoded glyoxylate reductase shows moderate affinity to the substrate glyoxylate, we used GLYR1 from Arabidopsis thaliana instead. Previous studies reported an enhanced affinity of AtGLYR1 to glyoxylate [3] and also enhanced activity [1]. The enzyme has a molecular weight of 30.7 kDa [4].
Figure 2: Structure of the NADPH-dependent glyoxylate reductase (AtGLYR1) with a molecular weight of 30.7 kDa.
Accumulating glyoxylate benefits the yield of glycolic acid. The isocitrate lyase 1, ICL1, catalyzes the reaction from isocitrate to glyoxylate. In the formation of glyoxylate, succinate occurs as a byproduct of the reaction. By overexpressing ICL1, a high substrate concentration is ensured. ICL1 has a molecular weight of 62.4 kDa[5].
Figure 3: Structure of the isocitrate lyase 1 (ICL1) with a molecular weight of 62.4 kDa.
The accumulation of glyoxylate is supported by the deletion of MLS1 and IDP2, since the corresponding enzymes degrade glyoxylate and isocitrate in unwanted side reactions. Consequently, previous deletions of both genes in S. cerevisiae significantly increased glycolic acid production titers[1]. MLS1, a malate synthase, catalyzes the conversion from glyoxylate to malate, and IDP2, an isocitrate dehydrogenase, catalyzes the oxidation of isocitrate to α-ketoglutarate.
As a result of our metabolic engineering approach, we were able to prove the activity of the glyoxylate reductase AtGLYR1 and the in vitro production of glycolic acid. We supposed a successful glycolic acid production in vivo. However, further HPLC analysis will be necessary.
Methods
The following methods have been applied in our lab work:
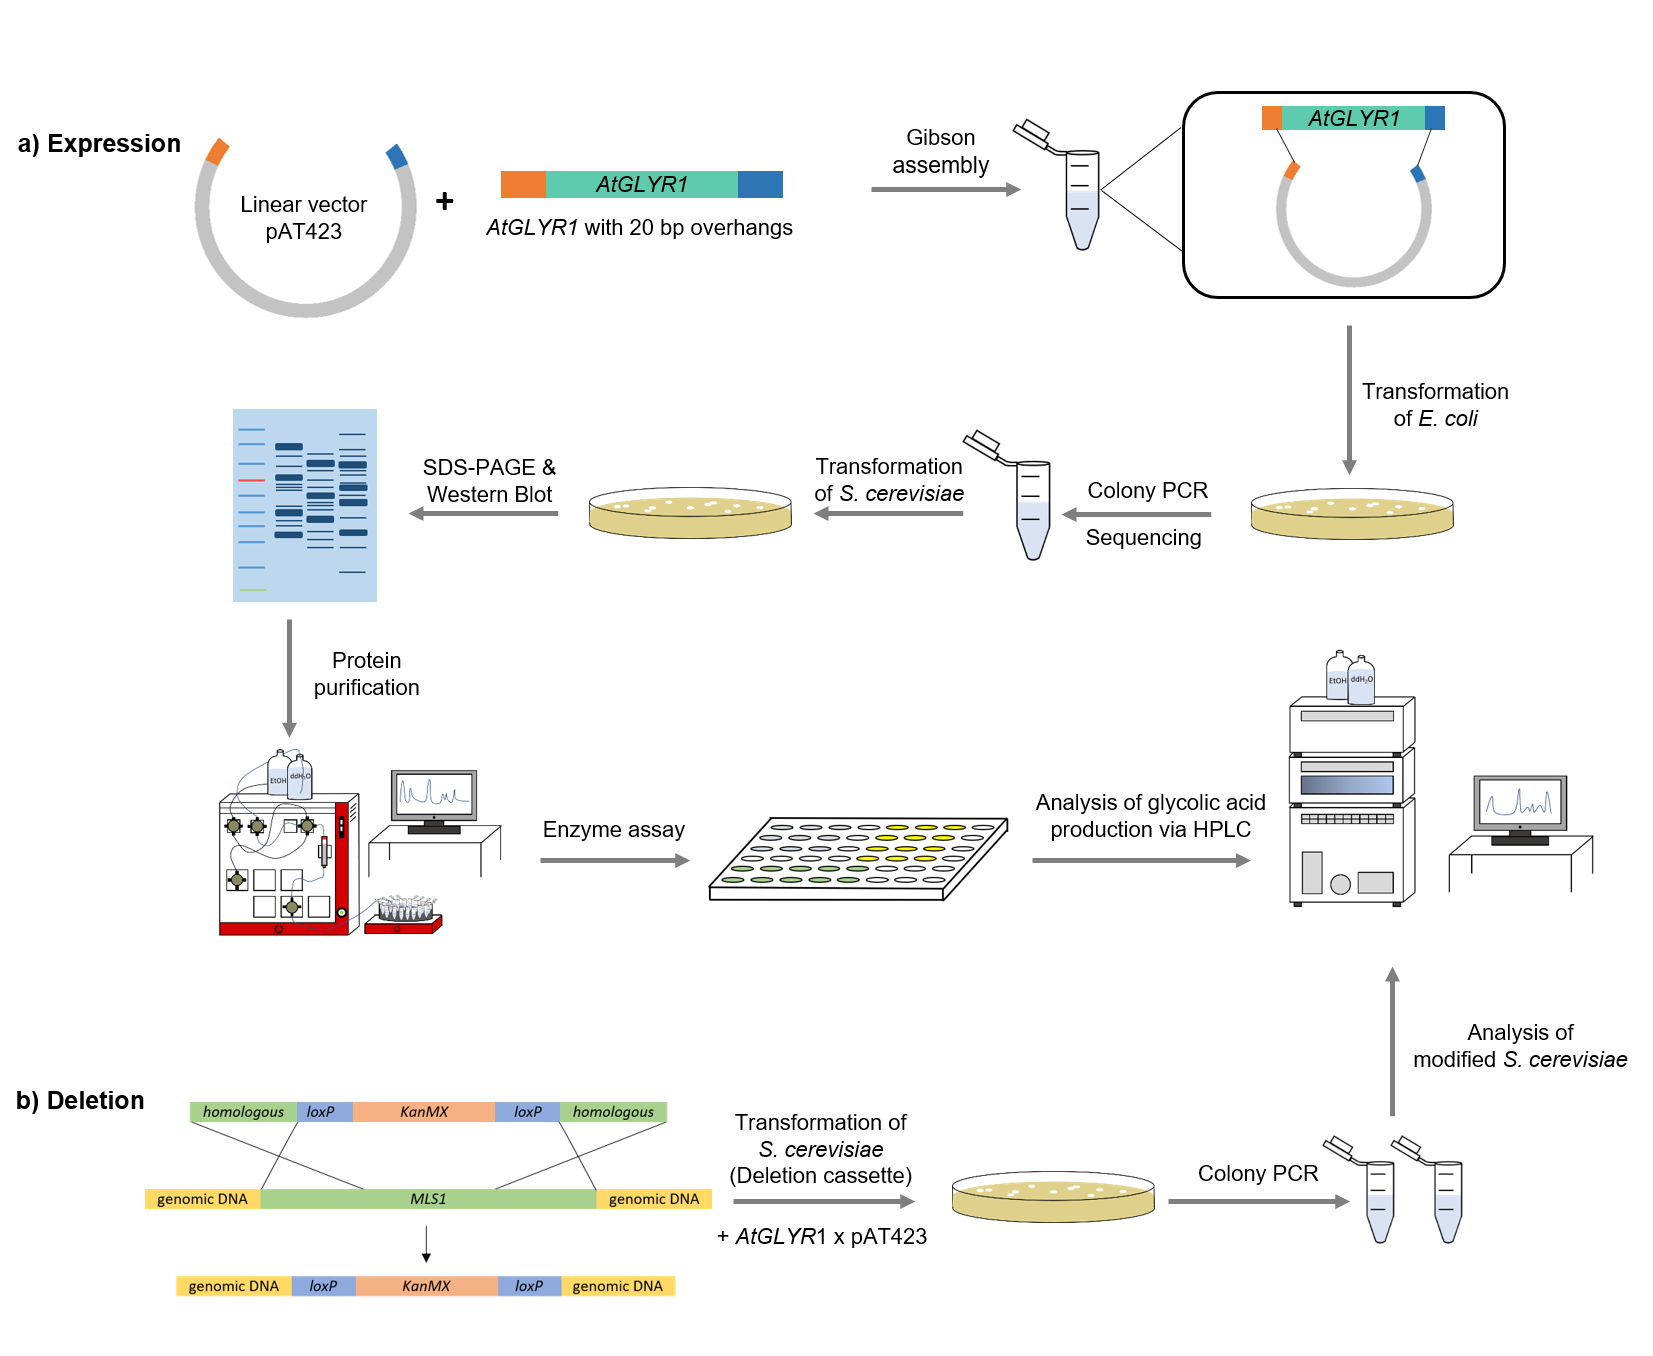
Figure 4: Schematic representation of work flow.
Cloning
Firstly, the sequence of AtGLYR1 was modified with a Strep-tag on the 3´end and 20 base pairs overhangs at both ends of the gene, which are complementary with the alcohol dehydrogenase promotor (ADH) of the pAT423 shuttle vector. The sequence was ordered from Integrated DNA Technologies (IDT) and inserted into the pAT423 plasmid using the Gibson assembly method. E. coli TOP10 were transformed with generated plasmids and positive colonies were identified via colony PCR and DNA sequencing.
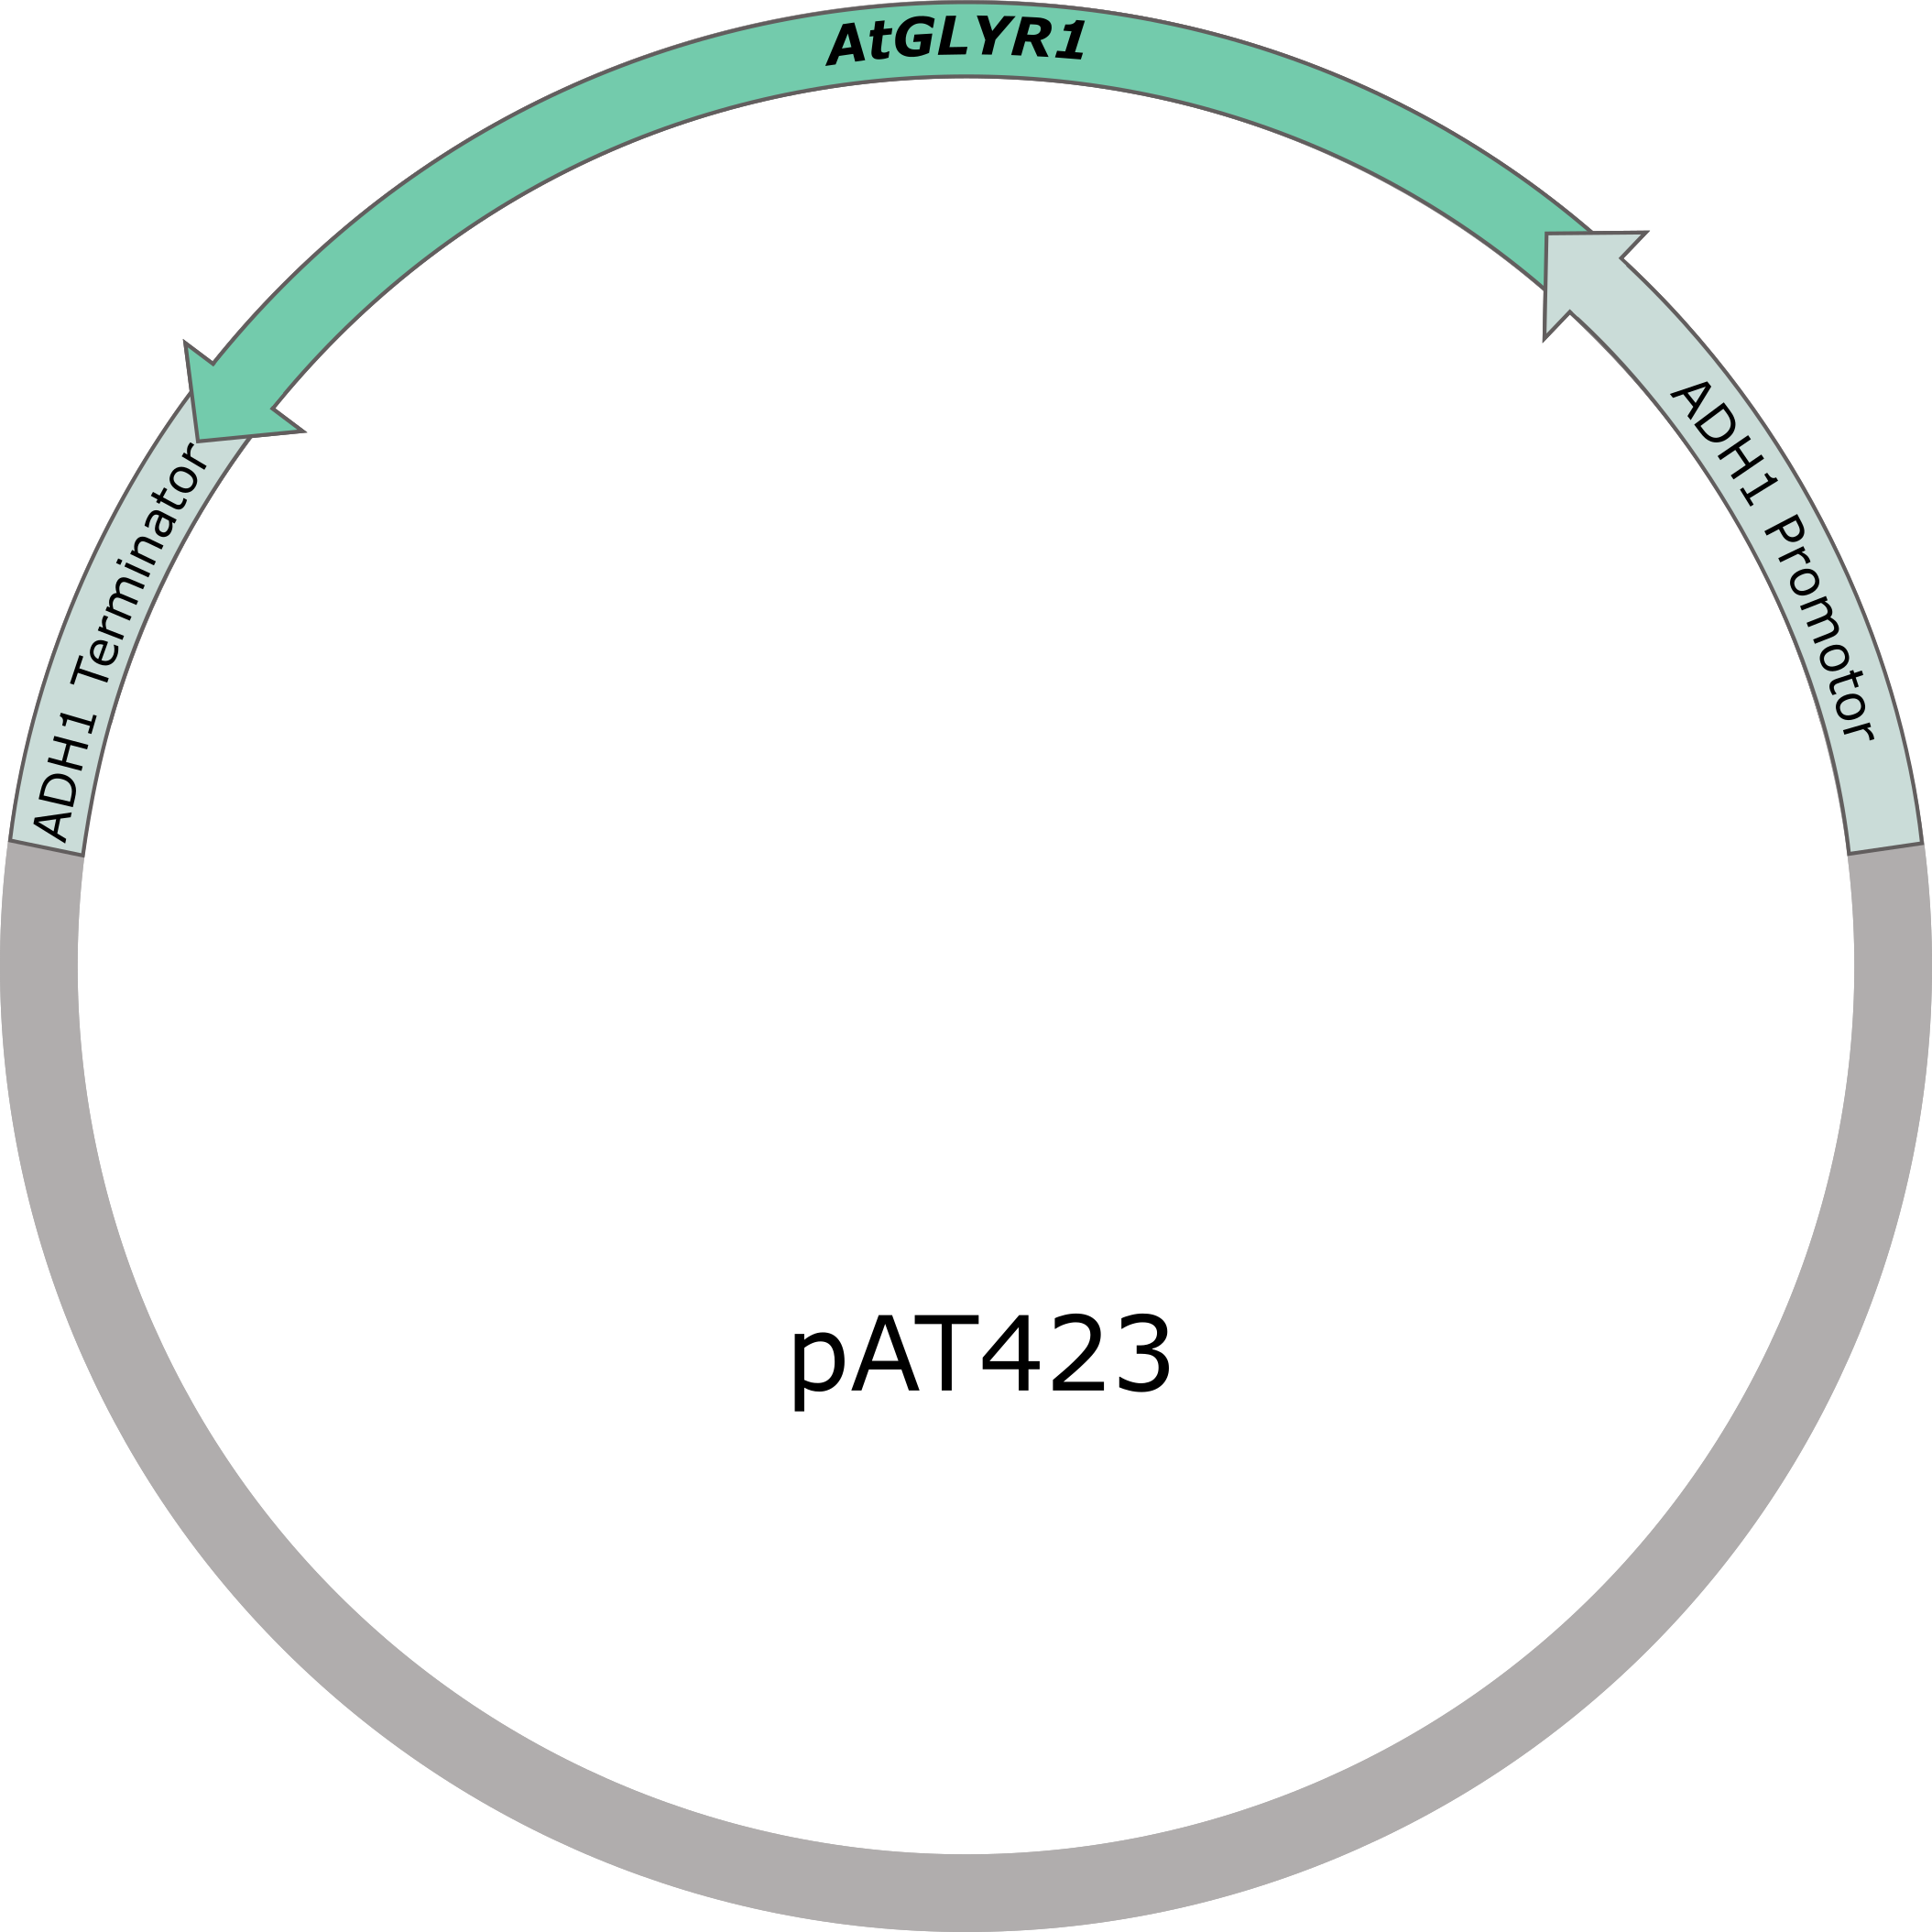
Figure 5: pAT423 plasmid including expression cassette of AtGLYR1.
Deletion
MLS1 and IDP2 were deleted from the genome of the S. cerevisiae using deletion cassettes, which were integrated into the genome by homologous recombination. Both deletion cassettes (KanMX cassette and Leucin cassette) were first amplified via PCR. The primers were binding to the loxP-sites and had a 40 bp homologous region to the gene of interest. After that, S. cerevisiae cells were transformed with the linearized amplified deletion cassettes, with the result that MLS1 was deleted using the KanMX and IDP2 using the Leucin cassette.
SDS-PAGE and Western Blot
To verify that AtGLYR1 was heterologously produced, a SDS-PAGE was performed, followed by a western blot. The resulting bands were compared to the expected molecular weight of 32.9 kDa.
Purification
After expression of AtGLYR1 in S. cerevisiae, a GE Healthcare ÄKTA Pure machine was used to purify the desired Strep-tagged enzyme.
Enzyme Assays
The assay for the glyoxylate reductase AtGLYR1 is based on the different absorption maxima of NADPH (absorption maxima at 260 and 340 nm) and NADP+ (maximum at 260 nm). During the reaction, the enzyme uses NADPH as a co-factor. NADPH is converted into NADP+, which leads to a decrease of absorption at 340 nm. By measuring the absorption at 340 nm over time, it is possible to quantify the enzyme activity and infer glycolic acid production. To calculate the NADPH conversion rate, a calibration curve was created by measuring the absorption of different NADPH concentrations.
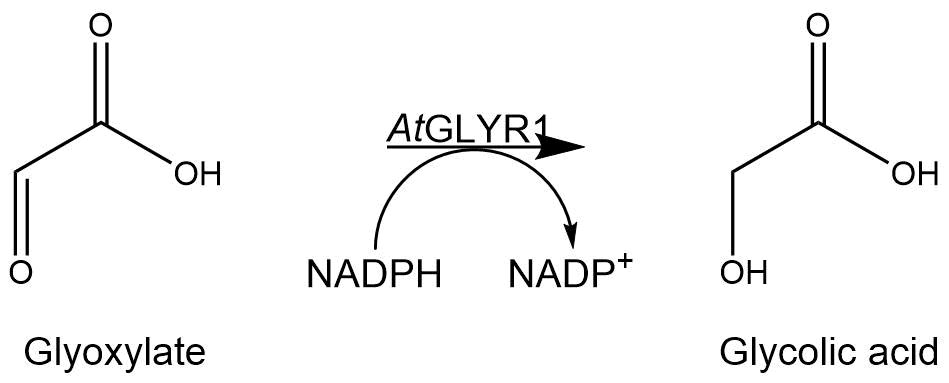
Figure 6: Reaction mechanism of NADPH-dependent conversion of glyoxylate into glycolic acid performed by AtGLYR1.
HPLC Analysis
To detect the produced monomer glycolic acid, as well as its precursors, high-performance liquid chromatography (HPLC) was employed. An organic acid separation column as stationary phase and sulfuric acid as mobile phase were used. This allowed the separation of glycolic acid, isocitrate and glyoxylate. Signals were recorded by a refractive index detector.
Results and Discussion
Deletions
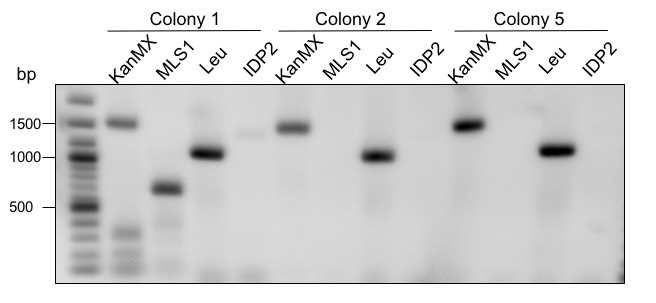
To increase the yield of glycolic acid in S. cerevisiae, the genes MLS1 (malate synthase) and IDP2 (cytosolic isocitrate dehydrogenase) were deleted. MLS1 converts glyoxylate to malate. Therefore, the amount of substrate for AtGLYR1 is minimized. IDP2 converts isocitrate to α–ketoglutarate. Isocitrate is also used by ICL1 as a substrate to produce glyoxylate. Since glyoxylate is the precursor of glycolic acid, as much isocitrate as possible should be converted to glyoxylate instead of α–ketoglutarate. To bypass these problems, the deletions were performed by transformation of CEN.PK-1C cells with a deletion cassette containing homologous regions to the flanking areas of the genes of interest (for a more detailed explanation see Methods). To determine whether or not the deletion of MLS1 and IDP2 worked, a PCR with two sets of primers was carried out. The primer sets contained the same forward primer but different reverse primers. If the deletion was not successful, only the reverse primer within the gene of interest would bind. If the deletion was successful, the reverse primer would bind within deletion cassette. Therefore, two PCRs per colony were performed. To see if the gene of interest or the deletion cassette was part of the genome, the colony PCR product was analyzed via agarose gel electrophoresis (Figure 7).
Figure 7: Gel electrophoretic separation for control of deletions. KanMX = rev primer binds in the KanMX cassette, MLS1 = rev primer binds in the MLS1 sequence, Leu = rev primer binds in the Leucin cassette, IDP2 = rev primer binds in the IDP2 sequence. 2-log ladder from NEB was used.
Three different colonies were screened (Figure 7). The expected fragment sizes were 1650 bp if the KanMX cassette was successfully replaced MLS1, and 1012 bp if not. Colony 1 shows the two signals for KanMX as well as MLS1. If the deletion of MLS1 had worked, only a fragment for KanMX should be visible. Therefore, colony 1 is a mixed culture. Colony 2 and 5 only show a fragment for KanMX but not for MLS1. This means that the deletion was performed successfully. IDP2 was deleted using a Leucin cassette instead of KanMX. The expected fragment sizes for the cassette and IDP2 were 1156 bp and 1498 bp, respectively. All three tested colonies show a clear fragment for Leucin at the expected size. The deletion of IDP2 was therefore successful. Colony 1 was not used for further experimental procedures.
Cloning and Expression
To produce glycolic acid in S. cerevisiae, a glyoxylate reductase from Arabidopsis thaliana is needed to be expressed. The native glyoxylate reductase GOR1 does not have an affinity to glyoxylate as high as AtGLYR1 from A. thaliana. A S. cerevisiae codon optimized version of the sequence coding for AtGLYR1 containing a Strep-tag was ordered from IDT. The sequence was inserted into a shuttle vector (pAT423), which can be used for gene expression in S. cerevisiae, as well as in E. coli. The cloning was done using the Gibson assembly method. The accuracy of the cloning was confirmed by sequencing.
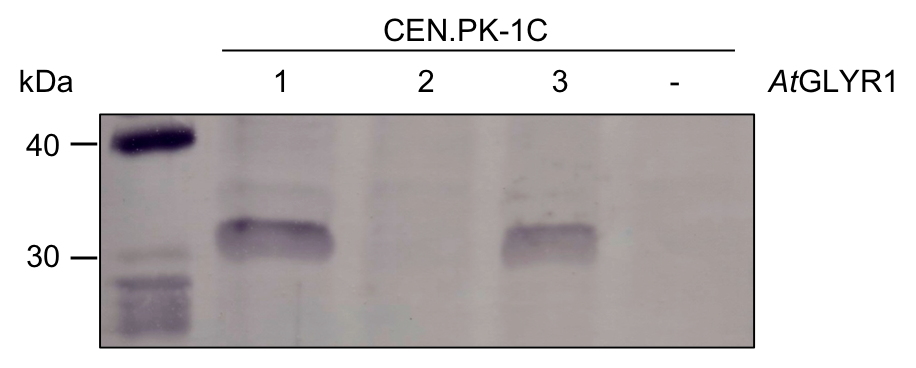
To test whether AtGLYR1 was produced in S. cerevisiae, we performed a western blot. We tested three colonies which were grown on selective medium after transformation with AtGLYR1 x pAT423. As a negative control, untransformed CEN.PK-1C cells were used. The resulting western blot is shown in Figure 8. AtGLYR1 was designed to contain a Strep-tag. Therefore, an anti-Strep antibody was used to detect the tagged protein with an expected molecular mass of 31.9 kDa.
Figure 8: Western blot for AtGLYR1. Three colonies were screened for the production of AtGLYR1 in S. cerevisiae. Thermo Scientific PageRuler Prestained Protein Ladder was used as protein standard. 1-3 = CEN.PK-1C was transformed using AtGLYR1 x pAT423; - = Negative control of untransformed CEN.PK-1C.
The western blot shows the results of three colonies, which were screened for the production of AtGLYR1. Colony 1 and 3 produced AtGLYR1. Colony 2 shows no band at the expected height. A corresponding positive colony was used for further experimental procedures. After gene expression for up to 22h, the protein was purified via StrepTactin columns using an ÄKTA system.
Enzyme Assay
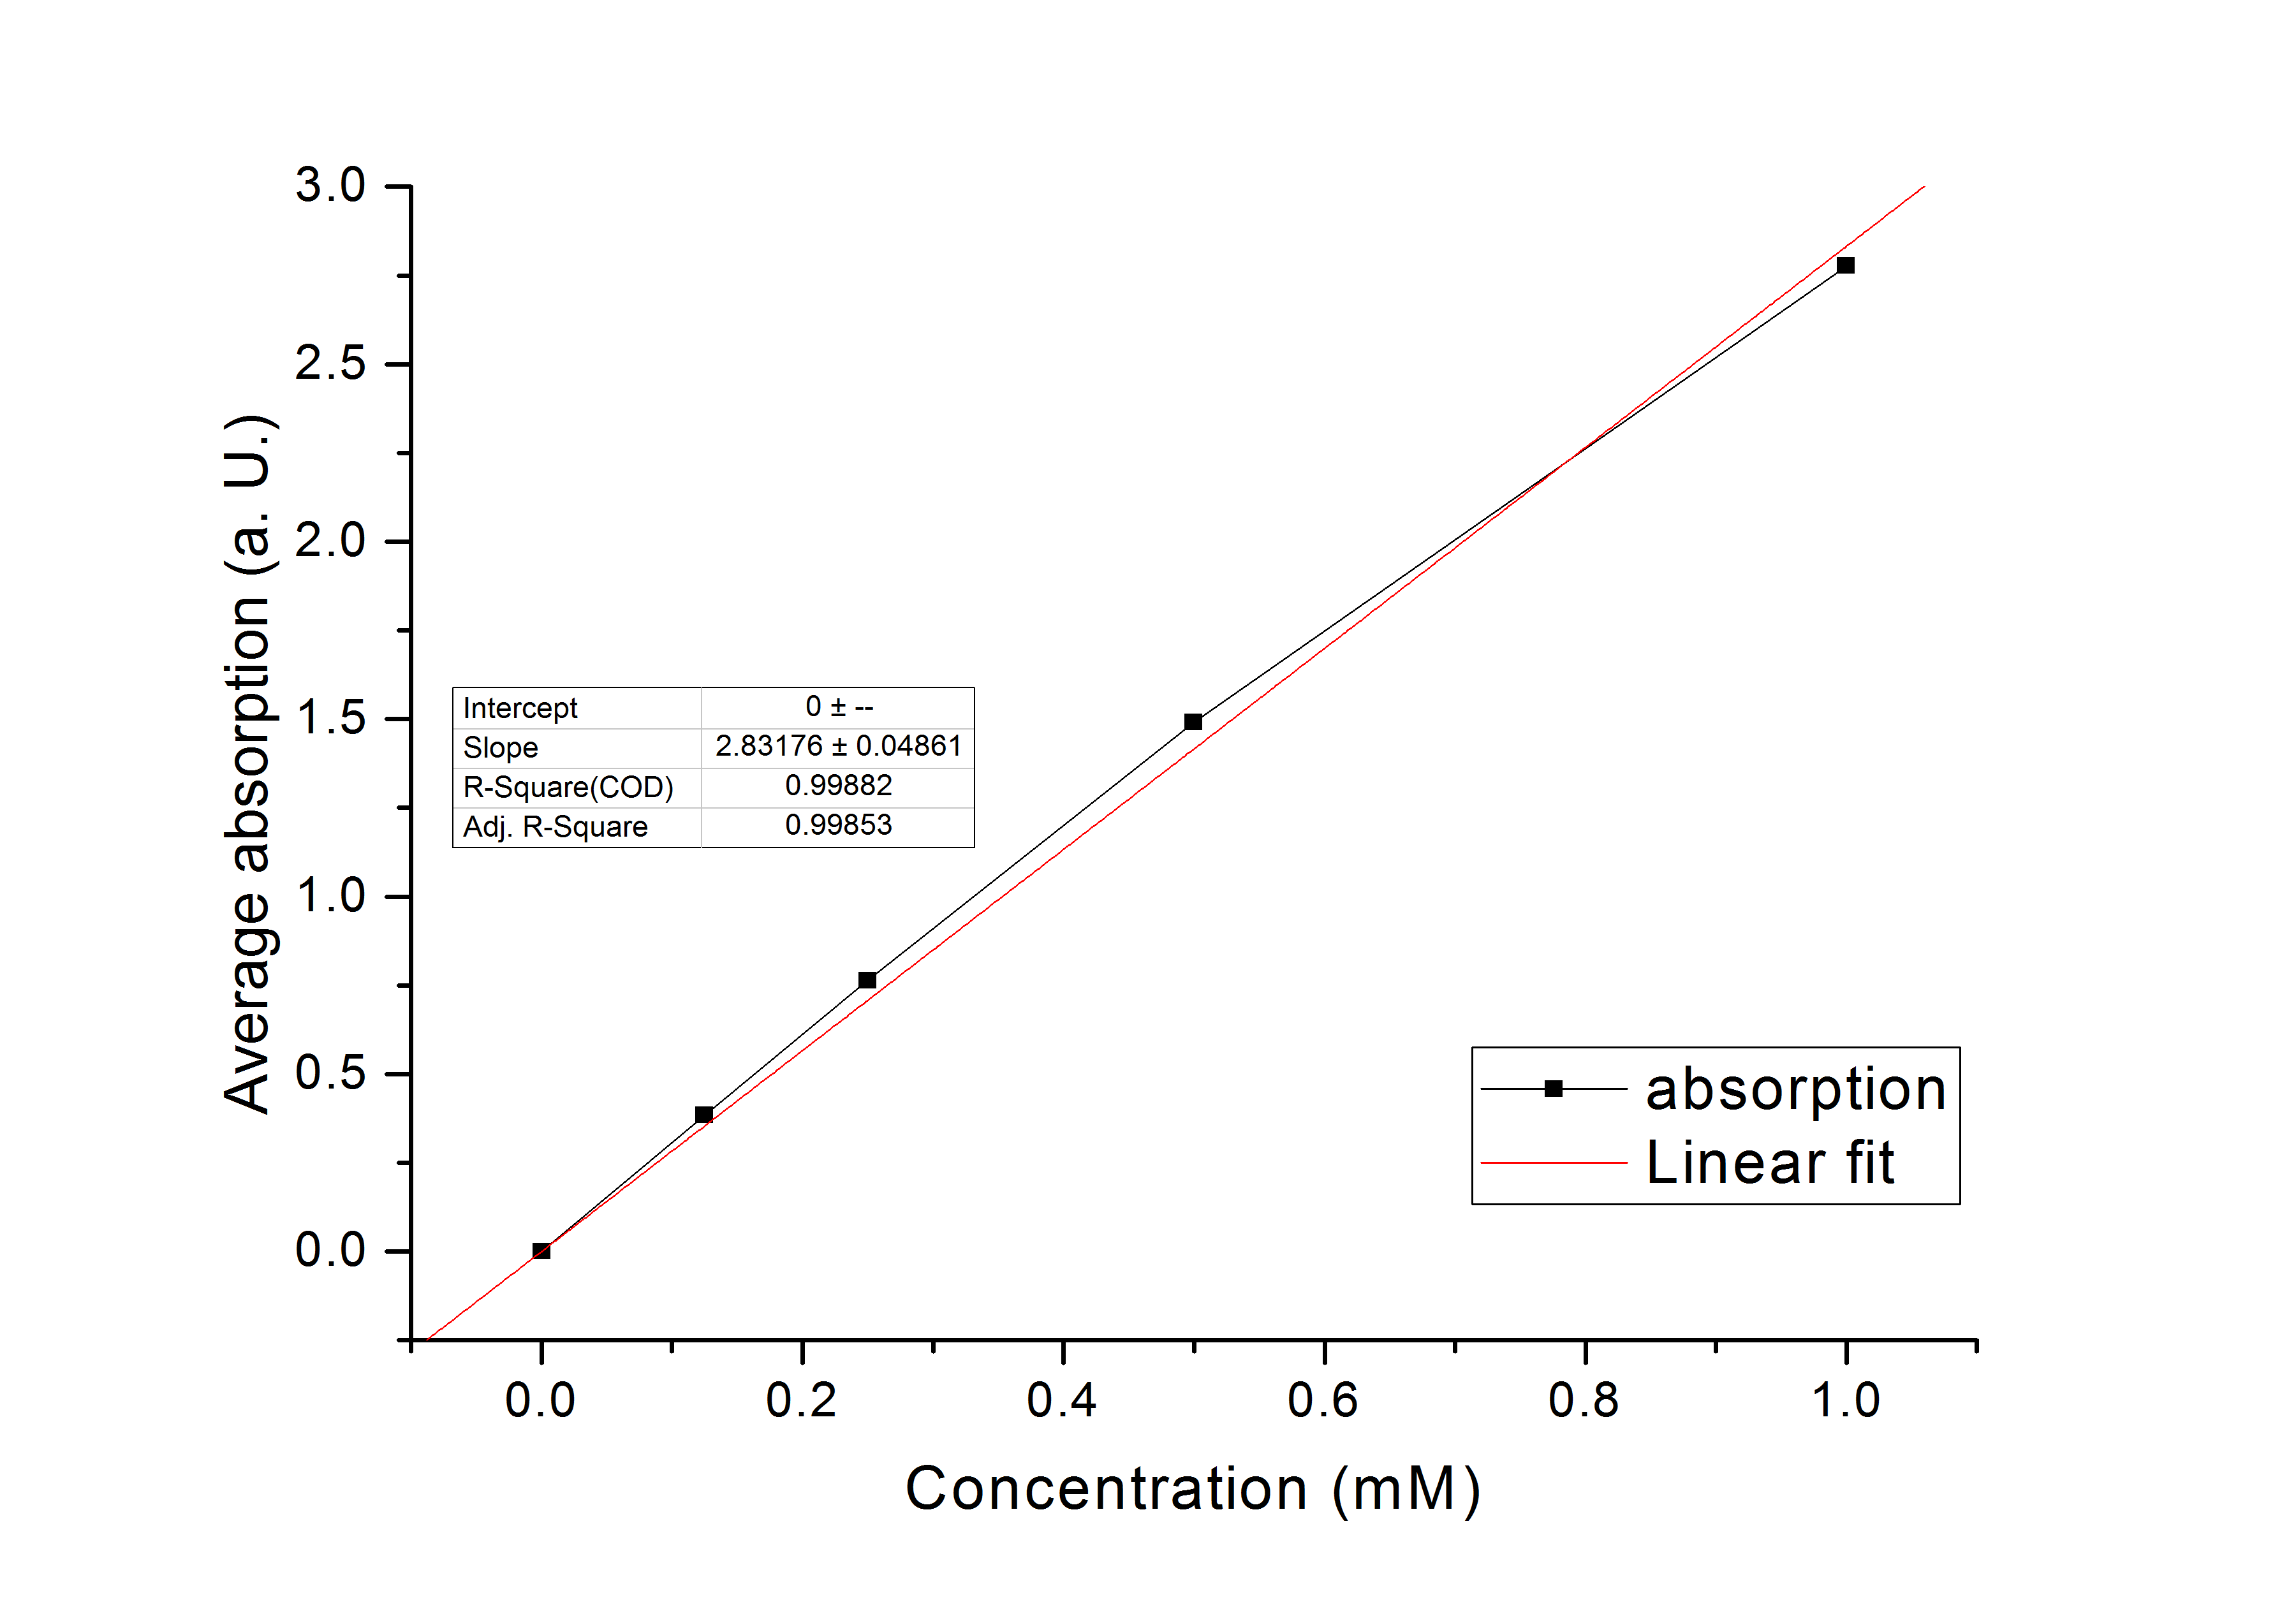
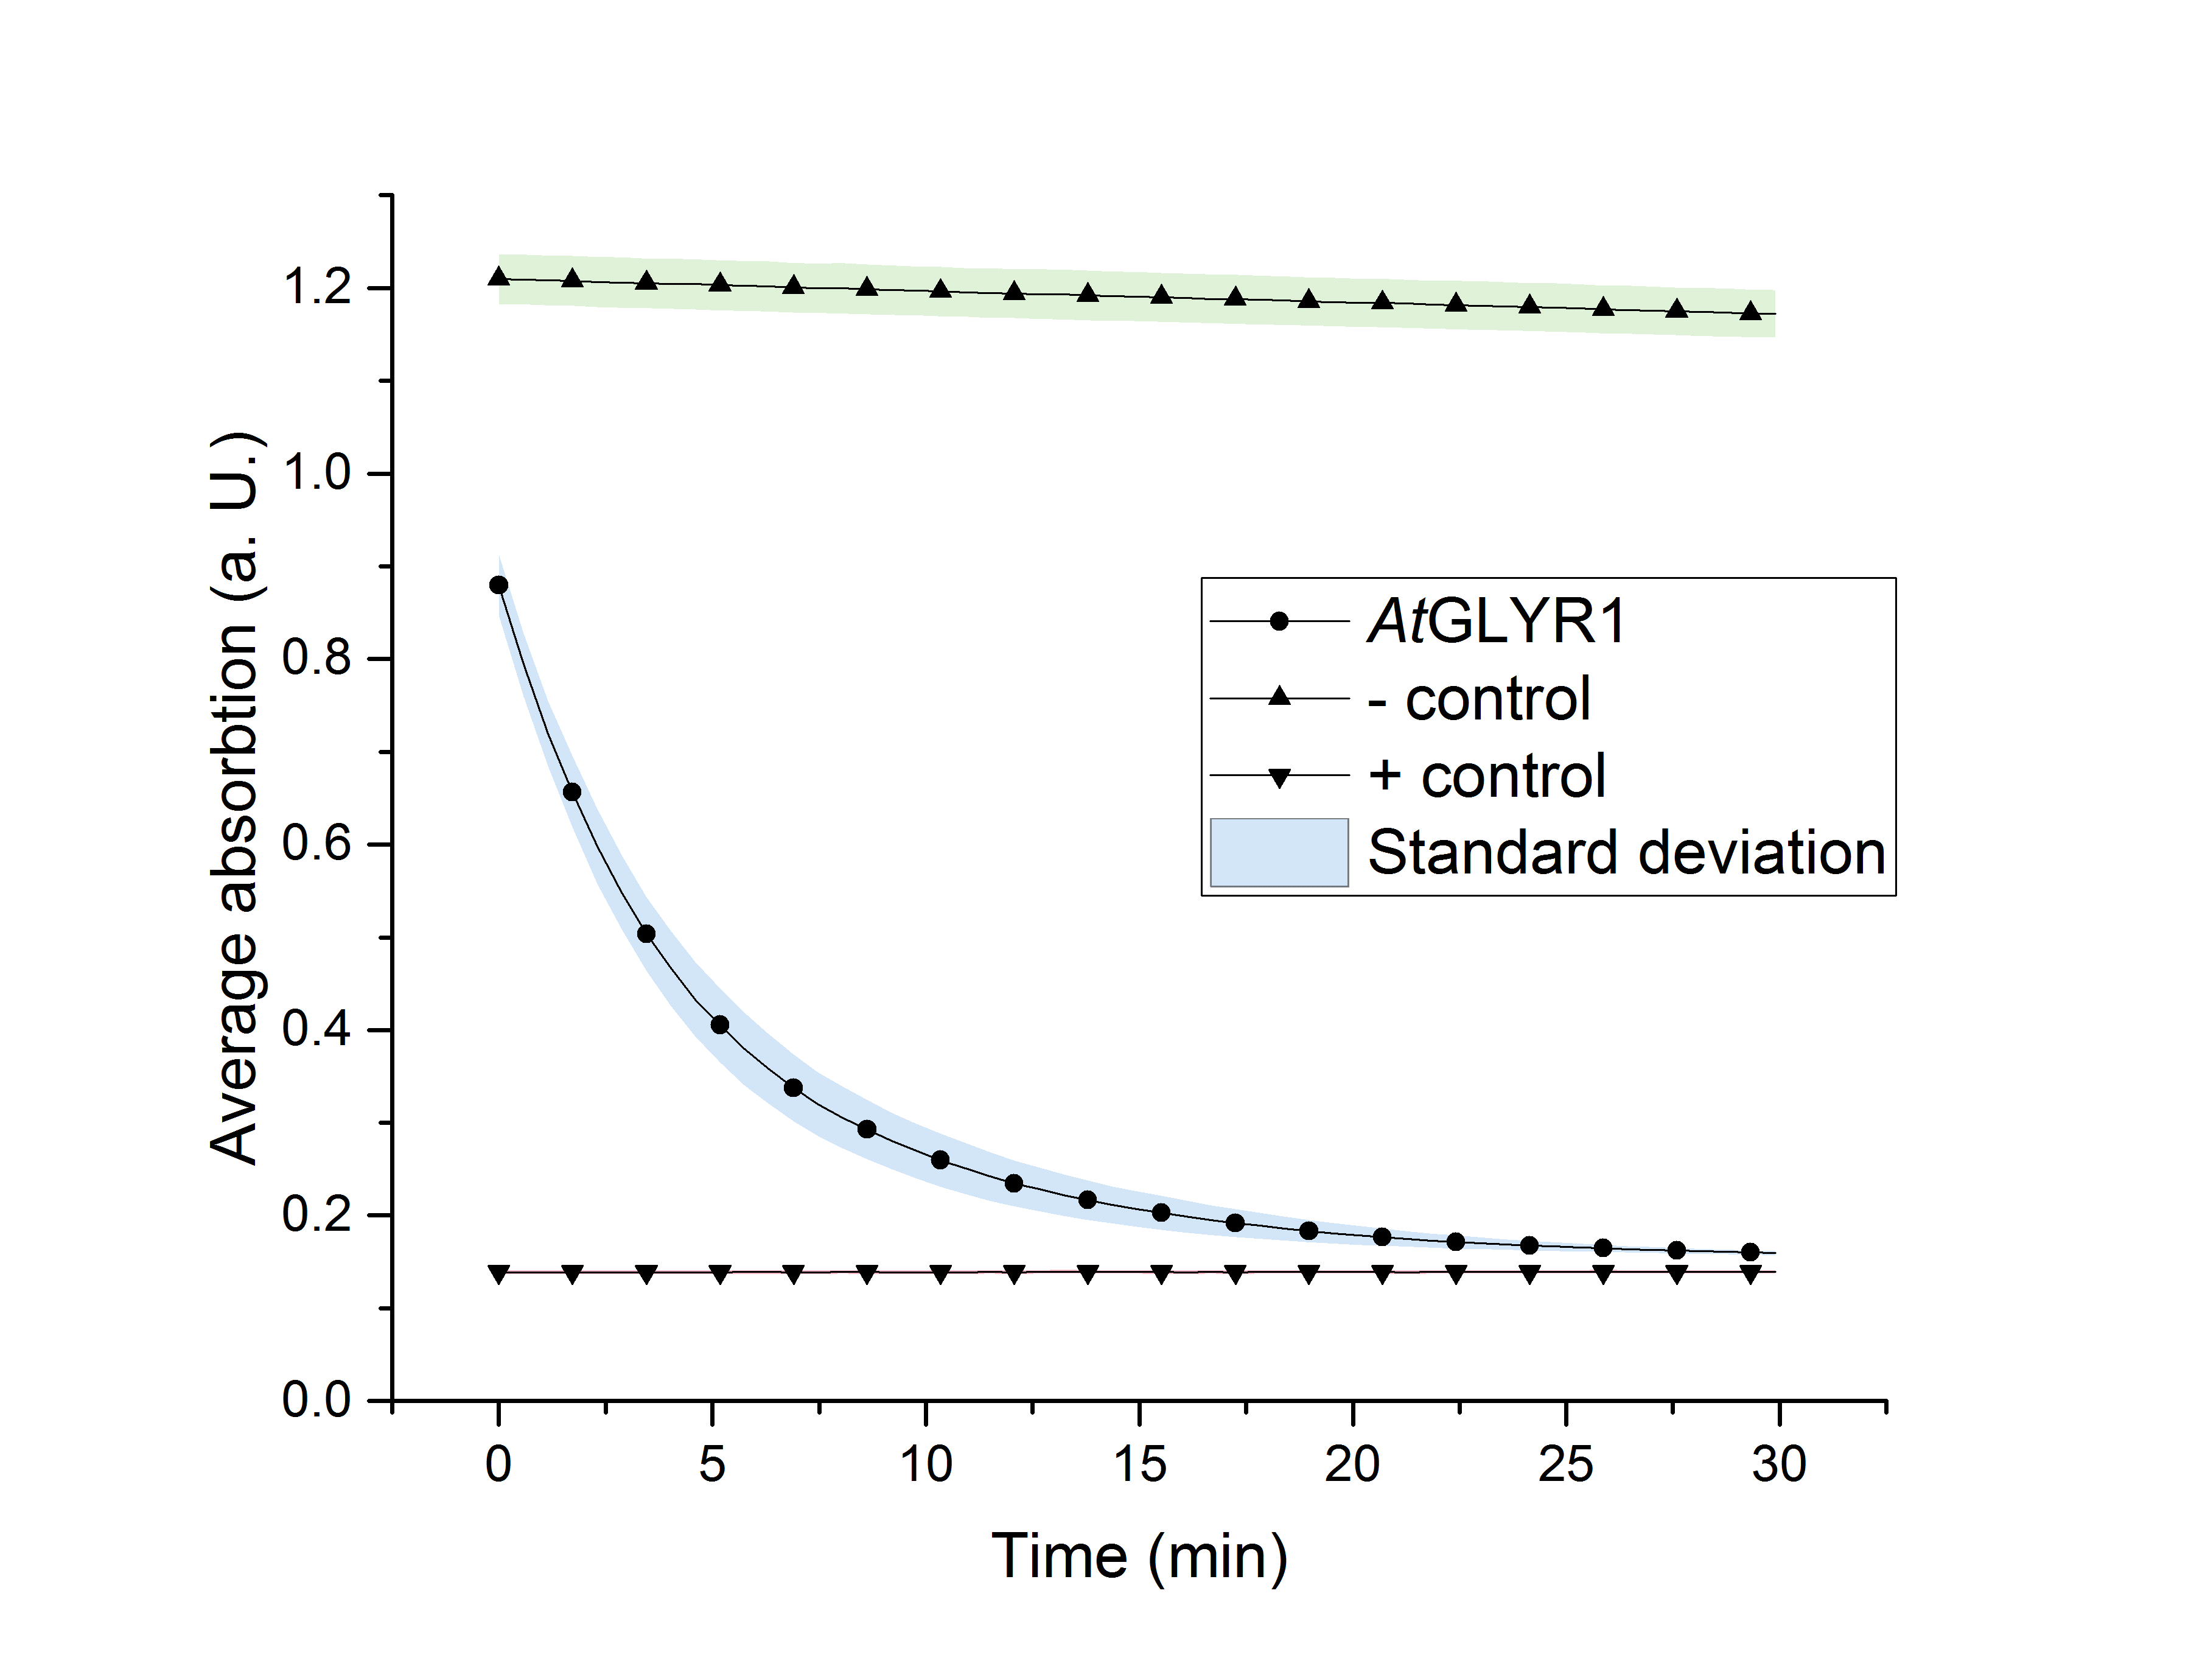
The purified enzyme was subjected to a determination of its biological activity. The assay was based on the oxidization of NADPH. While the purified AtGLYR1 oxidizes NADPH, glyoxylate is being reduced to glycolic acid. The conversion of NADPH to NADP+ can be recognized through a decrease in absorption at 340 nm. Since the conversion of NADPH comes along with the reduction of glyoxylate, this assay can proof the activity of the enzyme and the possible in vitro production of glycolic acid. For the calibration curve, the absorption of different concentrations of NADPH was measured and used to calculate the substrate turnover rate (Figure 9). The purified AtGLYR1 was assayed at 30 °C (Figure 10).
Figure 9 (left): Calibration curve for AtGLYR1 enzyme assay. Different NADPH concentrations (1 mM, 0.5 mM, 0.25 mM, 0.125 mM and 0 mM) were measured and plotted against their average absorption. n=3.
Figure 10 (right): NADPH dependent enzyme assay of AtGLYR1 at 30 °C. The graph shows the average absorption at 340 nm in correlation to the time (min). For the enzyme assay 2.7 ng/µL were used, positive (NADP+) and negative control (NADPH) were included. n=3.
The average absorption of both, the positive and negative controls, stays constant over the time. After about 30 minutes of reaction time, the curve almost reaches the absoprtion level of the positive control, consisting of pure NADP+. It can be assumed that the decrease of the average absorption in the enzyme containing sample is due to the functionality and activity of AtGLYR1, which oxidizes NADPH. The concentration of NADPH at the start of the assay was the same as for the negative control. Even though the enzyme is added to the reaction tube as the last component, the enzyme starts to work right before the first measurement point is recorded, so that the initial value was only 0.9 instead of 1.2.
The substrate conversion values were recorded in the linear range of the particular curve in a time frame of four minutes. Thus, 0.53 µM/s was the calculated substrat conversion rate of AtGLYR1 at 30 °C.
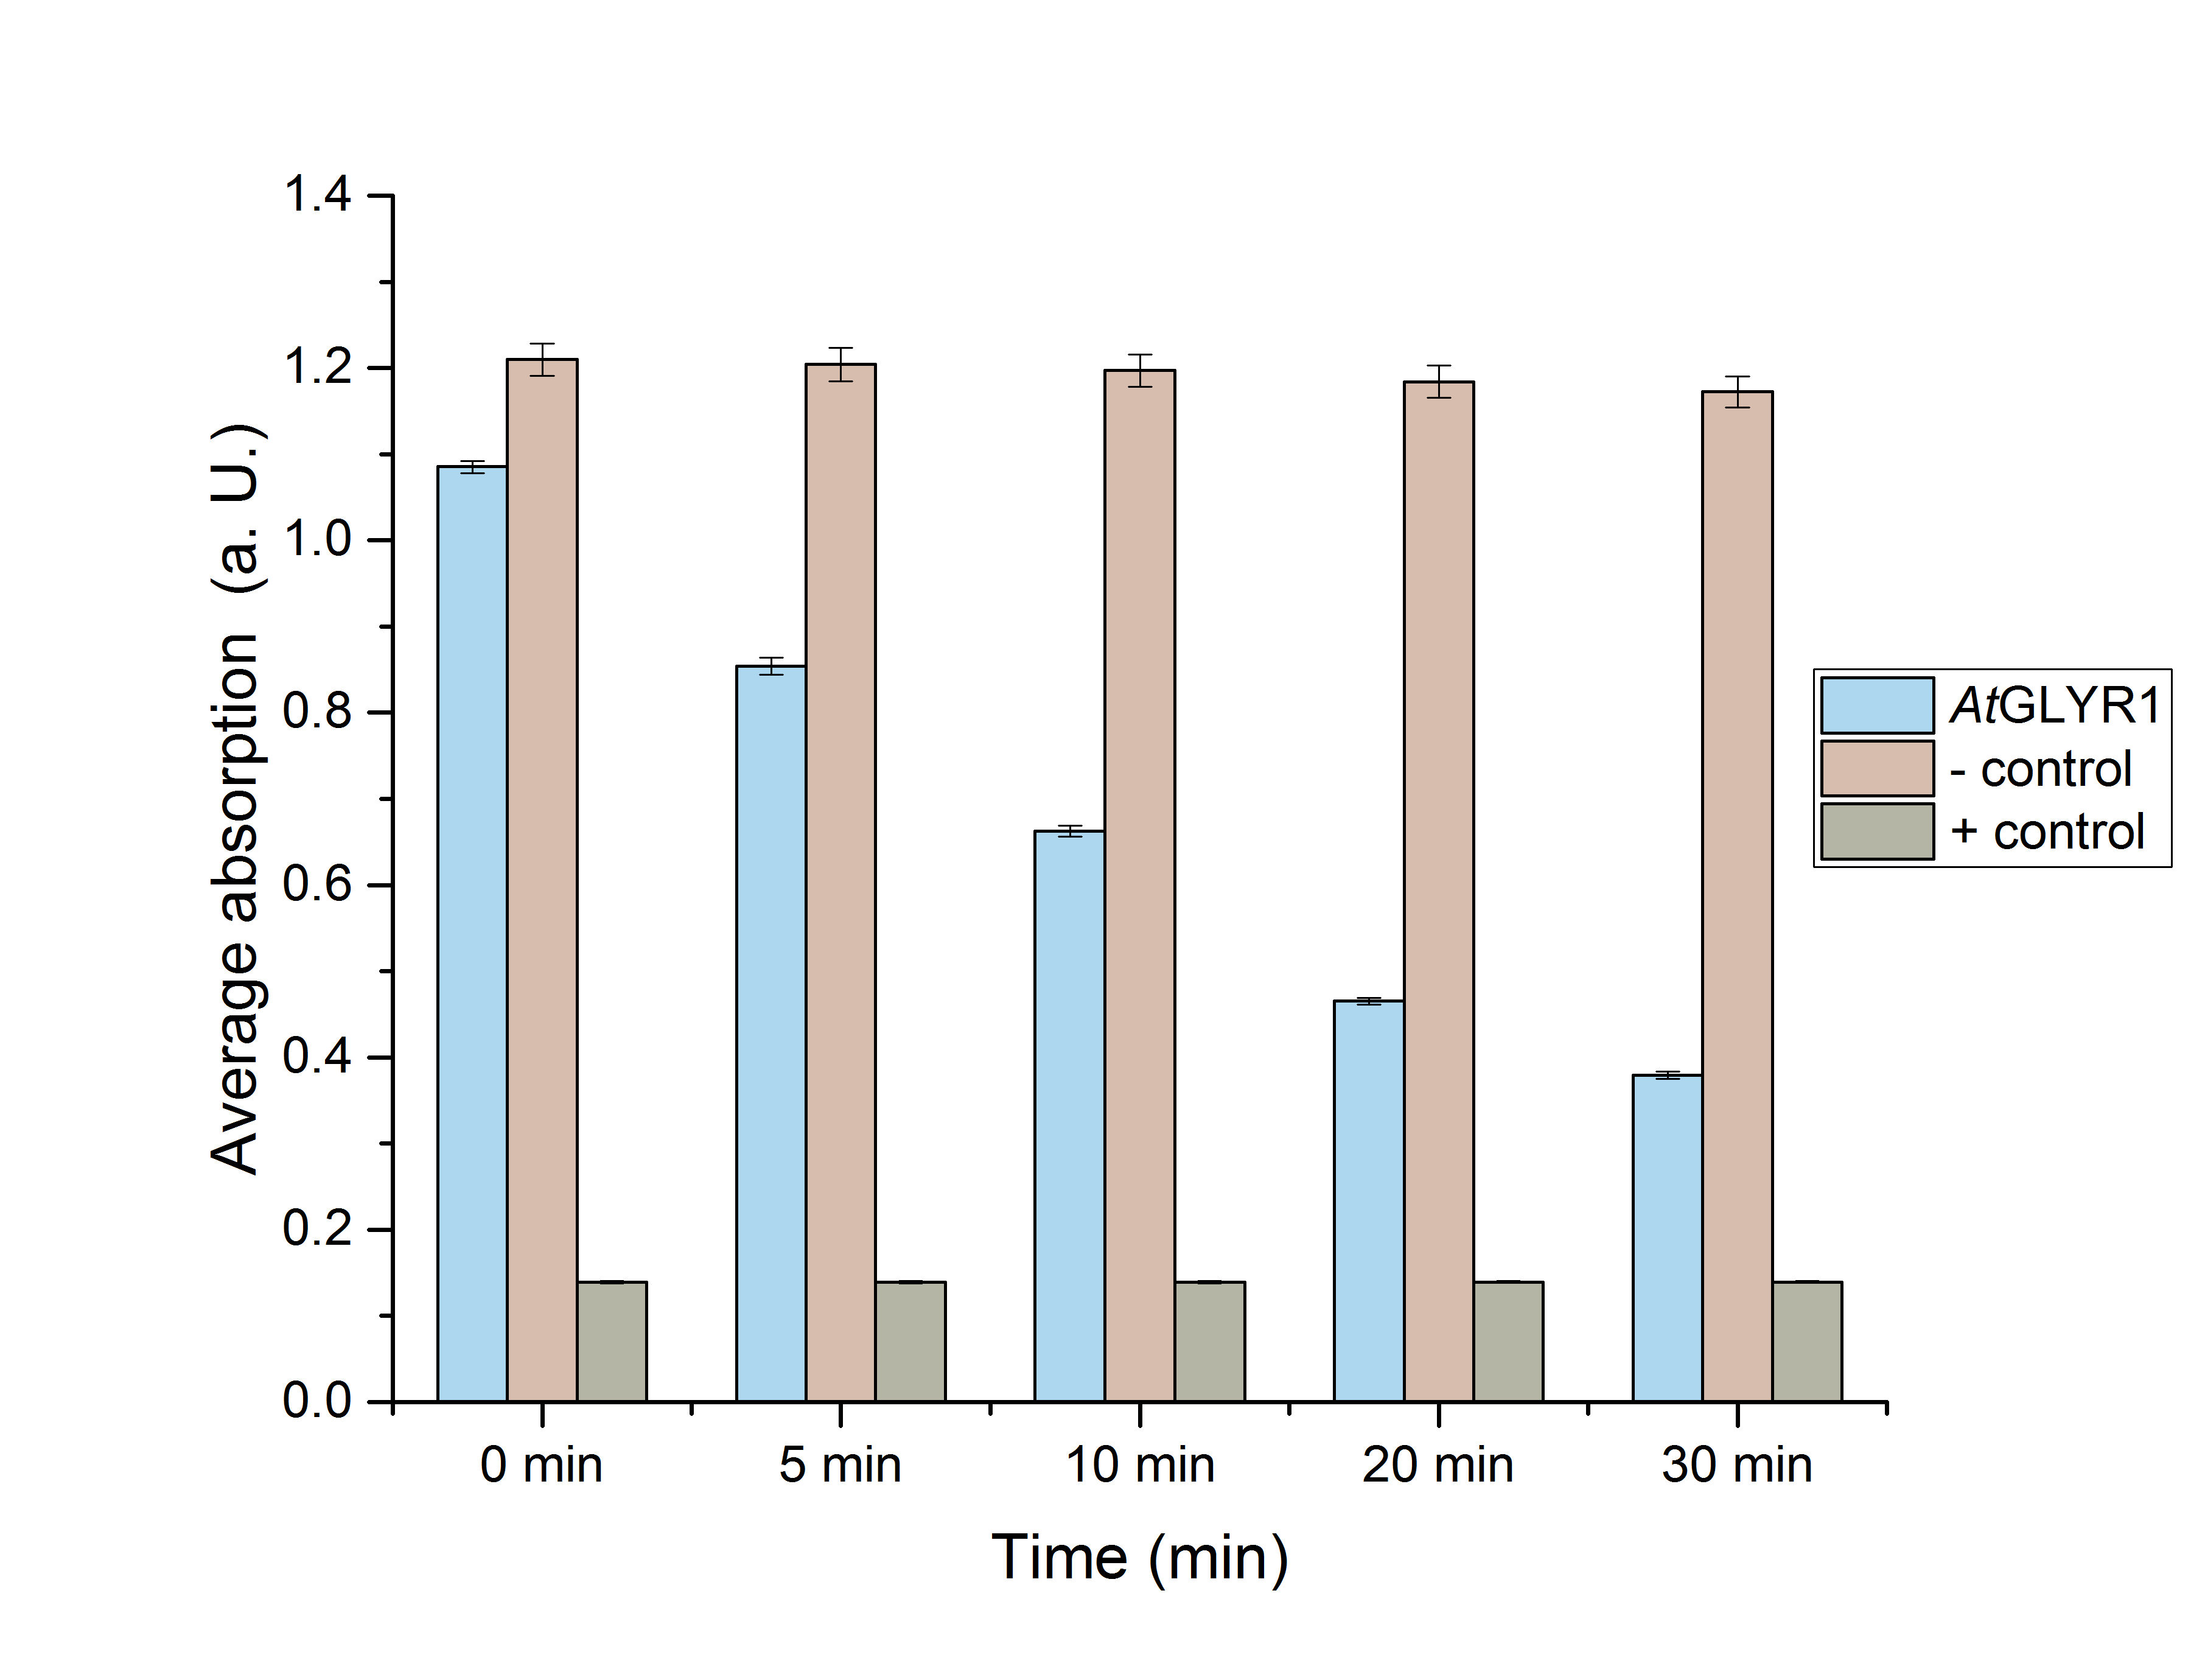
Next, a Student’s t-test was performed to see whether or not these results were significant. For this purpose, five data sets (0, 5, 10, 20 and 30 minutes) were chosen (Figure 11).
Figure 11: Enzyme assay absorption for 0, 5, 10, 20 and 30 minutes with standard error. n=3.
Table 1 includes the values for figure 11. It also shows the NADPH-absorption at chosen times, as well as the associated standard error.
Table 1: Calculated significance of AtGLYR1 data sets for 0, 5, 10, 20 and 30 minutes at 30 °C. The table also shows the NADPH-absorption, as well as the standard error. A= Absorption, *= Significance (p-value < 0.05), n= 3.
| AtGLYR1 [µg/mL] | A (t=0 min) | A (t=5 min) | A (t=10 min) | A (t=20 min) | A (t=30 min) |
|---|---|---|---|---|---|
| 2.7 | 0.879±0.023* | 0.433±0.028* | 0.27±0.021* | 0.179±0.007* | 0.16±0.002* |
| neg. | 1.209±0.019* | 1.204±0.019* | 1.197±0.019* | 1.184±0.018* | 1.172±0.018* |
| pos. | 0.139±0,001 | 0.139±0,001 | 0.139±0,001 | 0.139±0,001 | 0.14±0,001 |
Both figure 11 and table 1 show the significance of the enzymes’ activity.
Growth Assays and HPLC Analysis
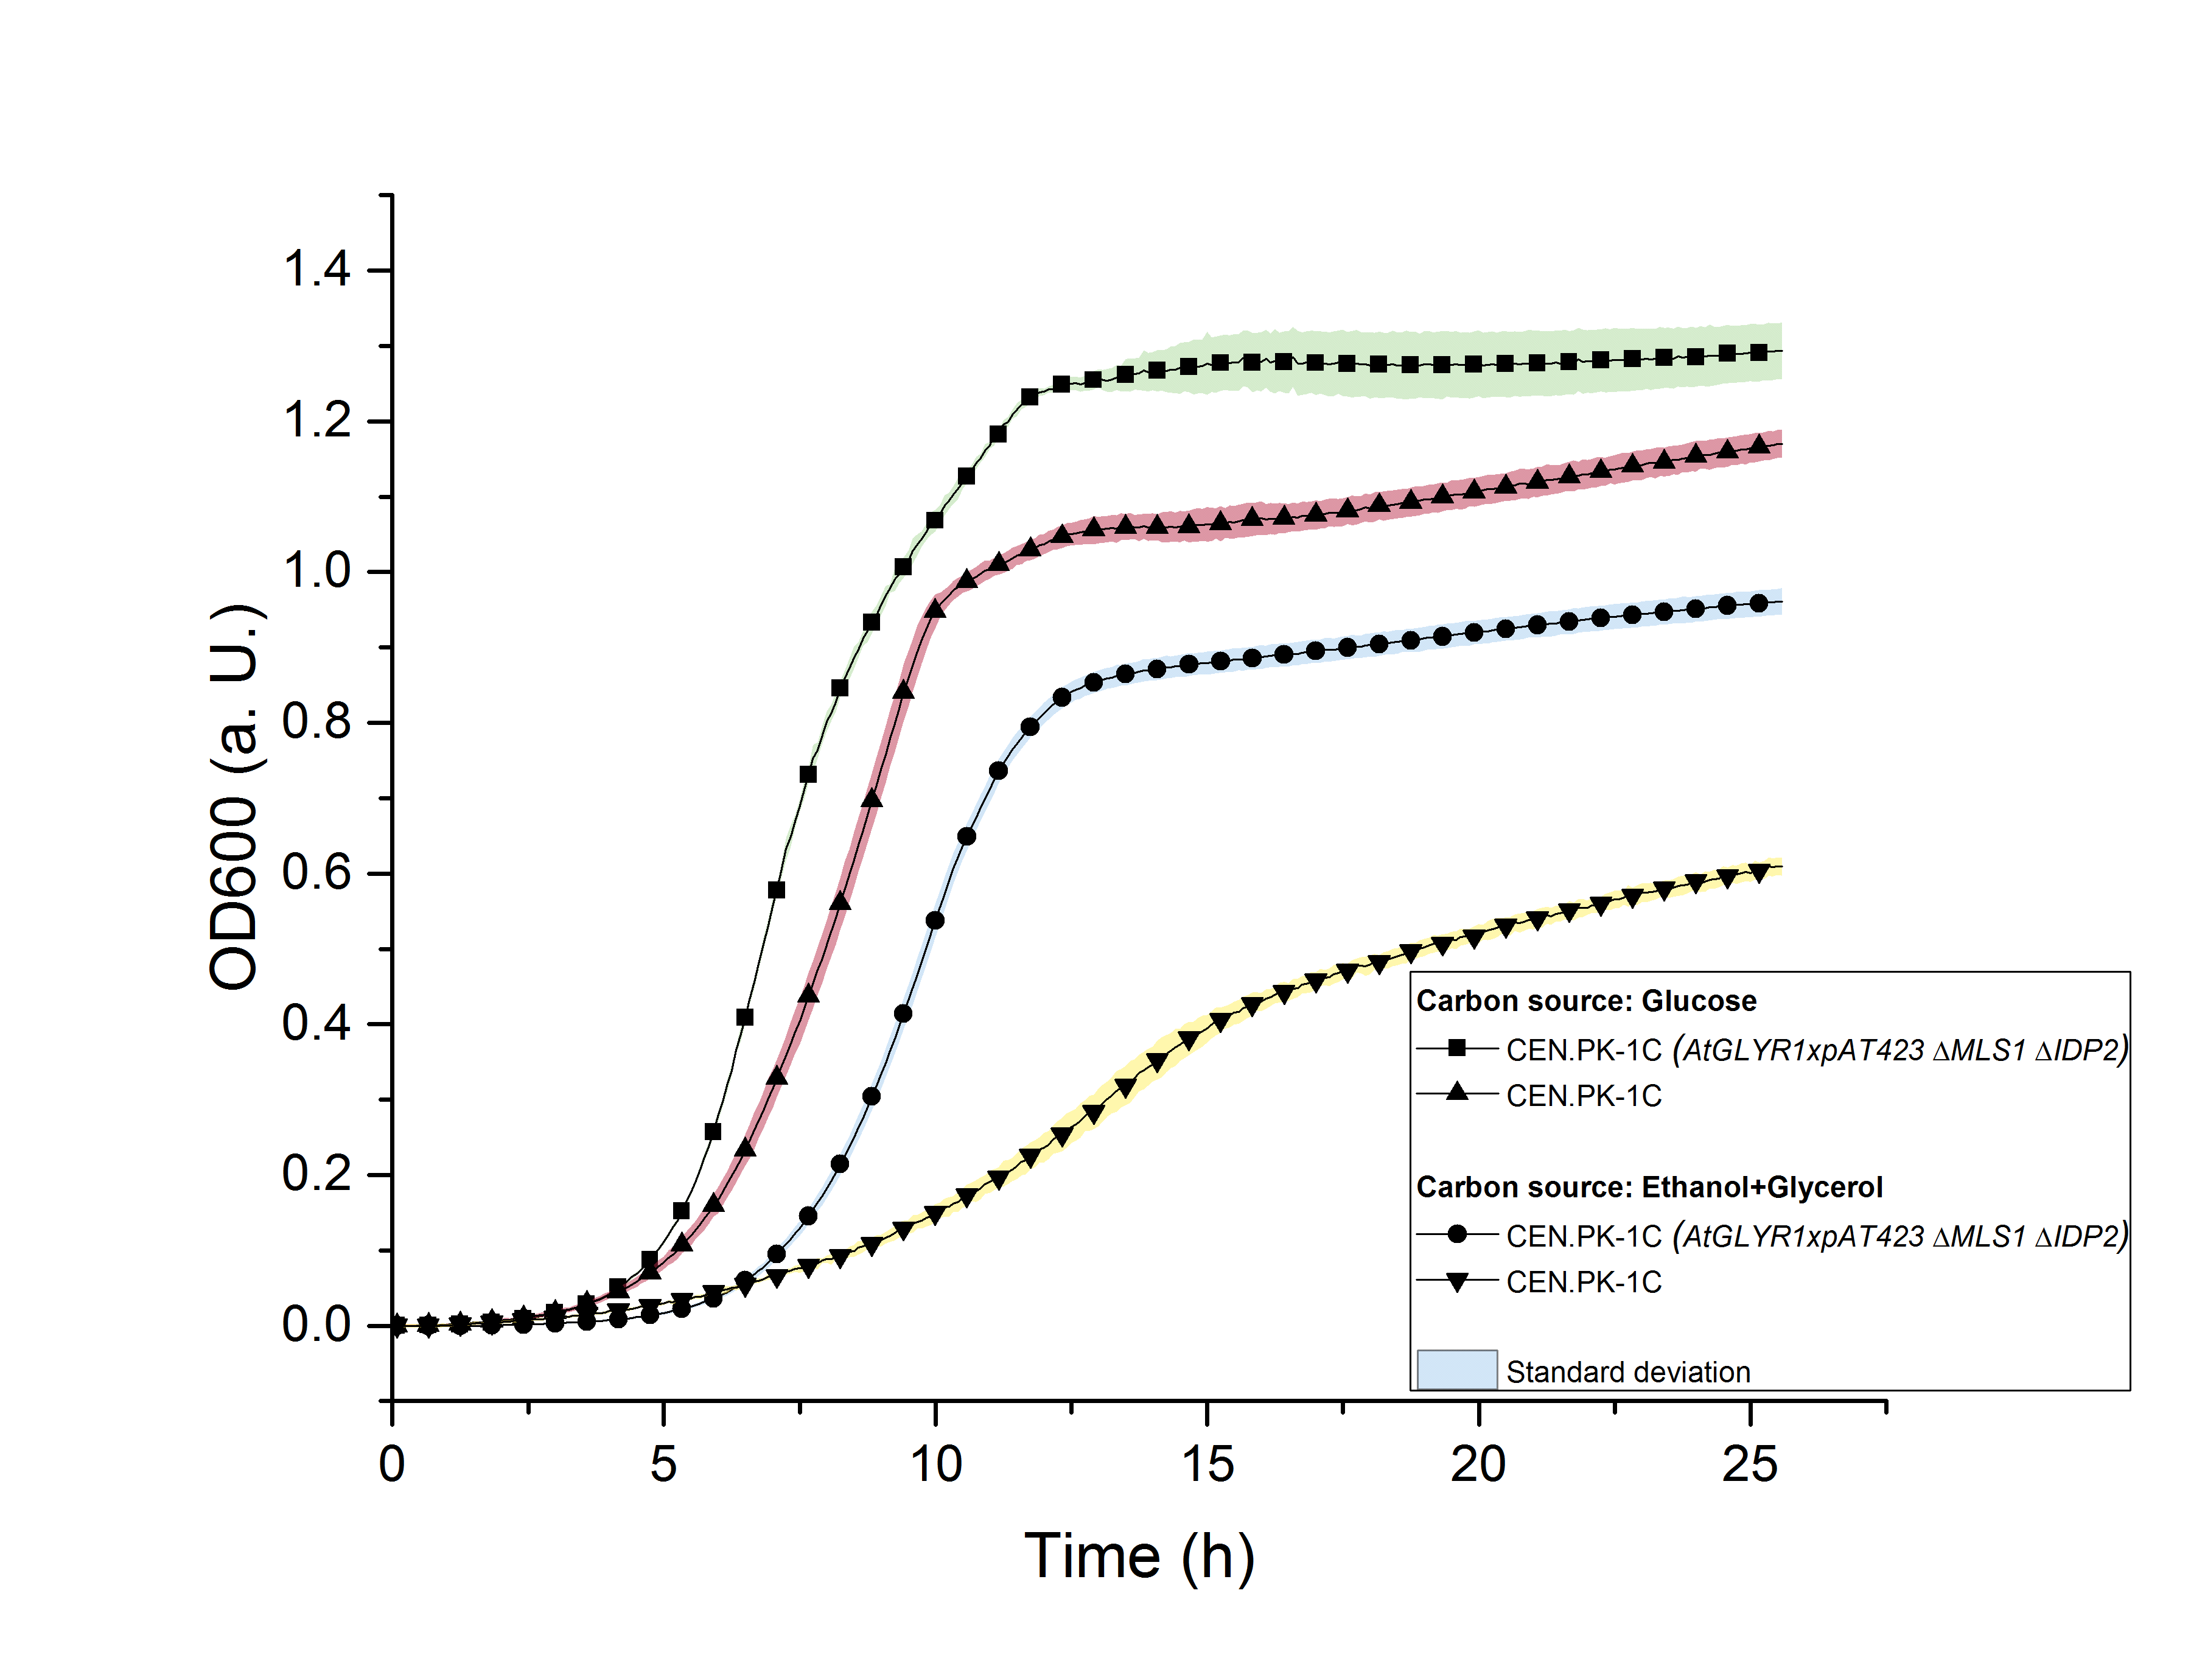
The deletion of MLS1 and IDP2 and the heterologous production of AtGLYR1 in S. cerevisiae could affect its growth. For this reason, we measured the growth of the strain CEN.PK-1C (AtGLYR1 x pAT423 ΔMLS1 ΔIDP2) in YPD- and in YPEG-medium for approximately 25 hours by recording OD600 values using a TECAN 200 pro reader. The same measurement was carried out with the wildtype strain. The YPD-medium contains glucose as a C-source, while YPEG-medium consists of ethanol and glycerol as C-sources. The growth of the wildtype was observed in the two different media. The stationary phase in YPG-medium was achieved after 10 hours (OD600 = 1.0) and in YPEG-medium after approximately 19 hours (OD600 = 0.55). The modified CEN.PK-1C strain reached the start of the stationary phase after 12.5 hours in both media. However, the growth is clearly reduced in YPEG-medium (OD600 = 0.9, figure 12).
Figure 12: Growth assay of CEN.PK-1C wildtype and CEN.PK-1C (AtGLYR1 x pAT423 ΔMLS1 ΔIDP2) in YPD- and YPEG-medium for 25 hours by OD600.
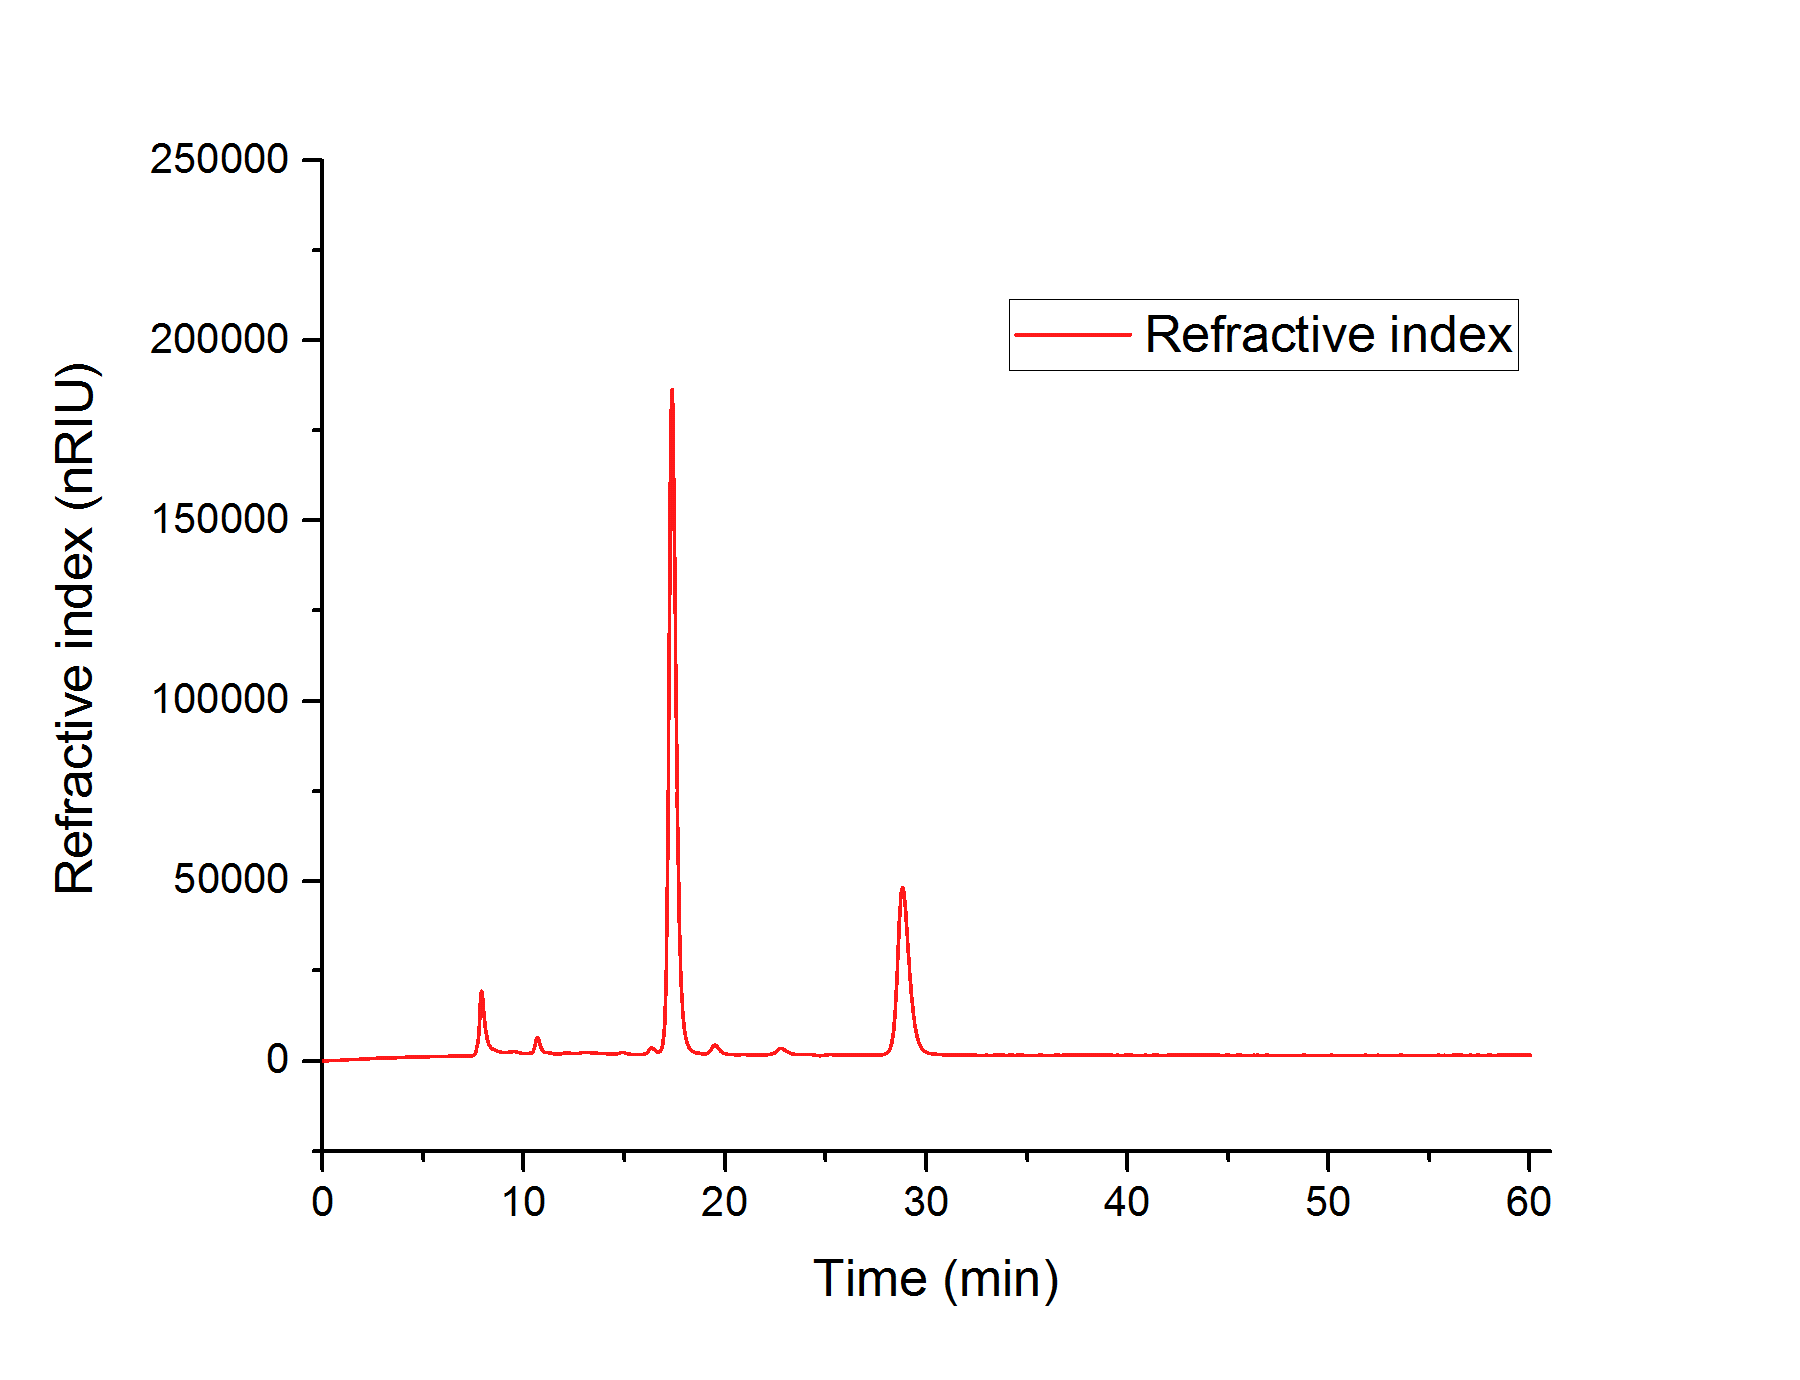
We concluded, that S. cerevisiae growths better in YPD- than in YPEG-medium and that the modified strain growths faster than the wildtype. For this reason, we suppose that S. cerevisiae indeed produces higher amounts of glycolic acid than unmodified strains but uses the produced glycolic acid as a new form of energy for faster growth. In order to prove that the modified strain produced glycolic acid, we analyzed the sterile-filtered supernatant of an overnight culture of CEN.PK-1C (AtGLYR1xpAT423 ΔMLS1 ΔIDP2) and the supernatant of another overnight culture of CEN.PK-1C (AtGLYR1xpAT423 ΔMLS1 ΔIDP2), after cell disruption via sonication using HPLC (Figure 13). The peak of the glycolic acid standard was observed after 15.7 minutes. In our HPLC measures we observed a peak after 16 minutes, which cannot be assigned to the glycolic acid peak. However, it could be possible that S. cerevisiae modified the produced glycolic acid, so that the peak of this modified glycolic acid molecule was observed after 16 minutes.
Figure 13: Elution profile for the different molecules of an overnight culture of CEN.PK-1C (AtGLYR1xpAT423 ΔMLS1 ΔIDP2) after the HPLC-analysis. A significantly peak is observed after 16 minutes, which could correspond to a modified glycolic acid molecule.
Outlook
Due to metabolic engineering of the glyoxylate cycle in S. cerevisiae, we were able to produce glycolic acid in vitro as one of our monomers for PLGA- and PGLC-synthesis. We also supposed, that its in vivo production was successful. However, further analysis via HPLC has to be carried out in order to validate our assumption. It has been shown that yeast acts as a suitable organism for genetic modifications and production of small organic acids. Yet, an emerging number of different yeast species have established themselves as microbial cell factories with at present unknown potential to further increase the yield of metabolic products. Recent work with Kluveromyces lactis [1] suggests that a higher titer of glycolic acid can be received by implementation of similar biosynthetic approaches on different organisms. Obtaining a quantitative analysis of the so produced monomers would therefore be of particular relevance for the comparison of the chosen production strains. In this regard, the currently applied method [6] including high-performance liquid chromatography with use of a refractive index detector for signal recording can be complemented with external standards in order to create a quantifying calibration curve.
Furthermore, the construction of a BioBrick-compliant shuttle vector for overexpression, protein purification with Strep-tag affinity chromatography and subsequent activity assays, similar to those performed on AceA in E. coli, is the next step in the process of glycolic acid production. For the construction of a stable AtGLYR1-encoding strain, the glyoxylate reductase gene could be integrated into the genome via homologous recombination, as transformed populations can suffer from plasmid instability [7]. Since the reaction catalyzed by AtGLYR1 is depending on NADPH, the effect of co-factor limitation and regenerating systems, like we used for the production of ε-caprolactone, could also be investigated. Coordinating the two-gene expression ratio of heterologous AtGLYR1 and overexpressed ICL1 is one potential future outlook.
Team
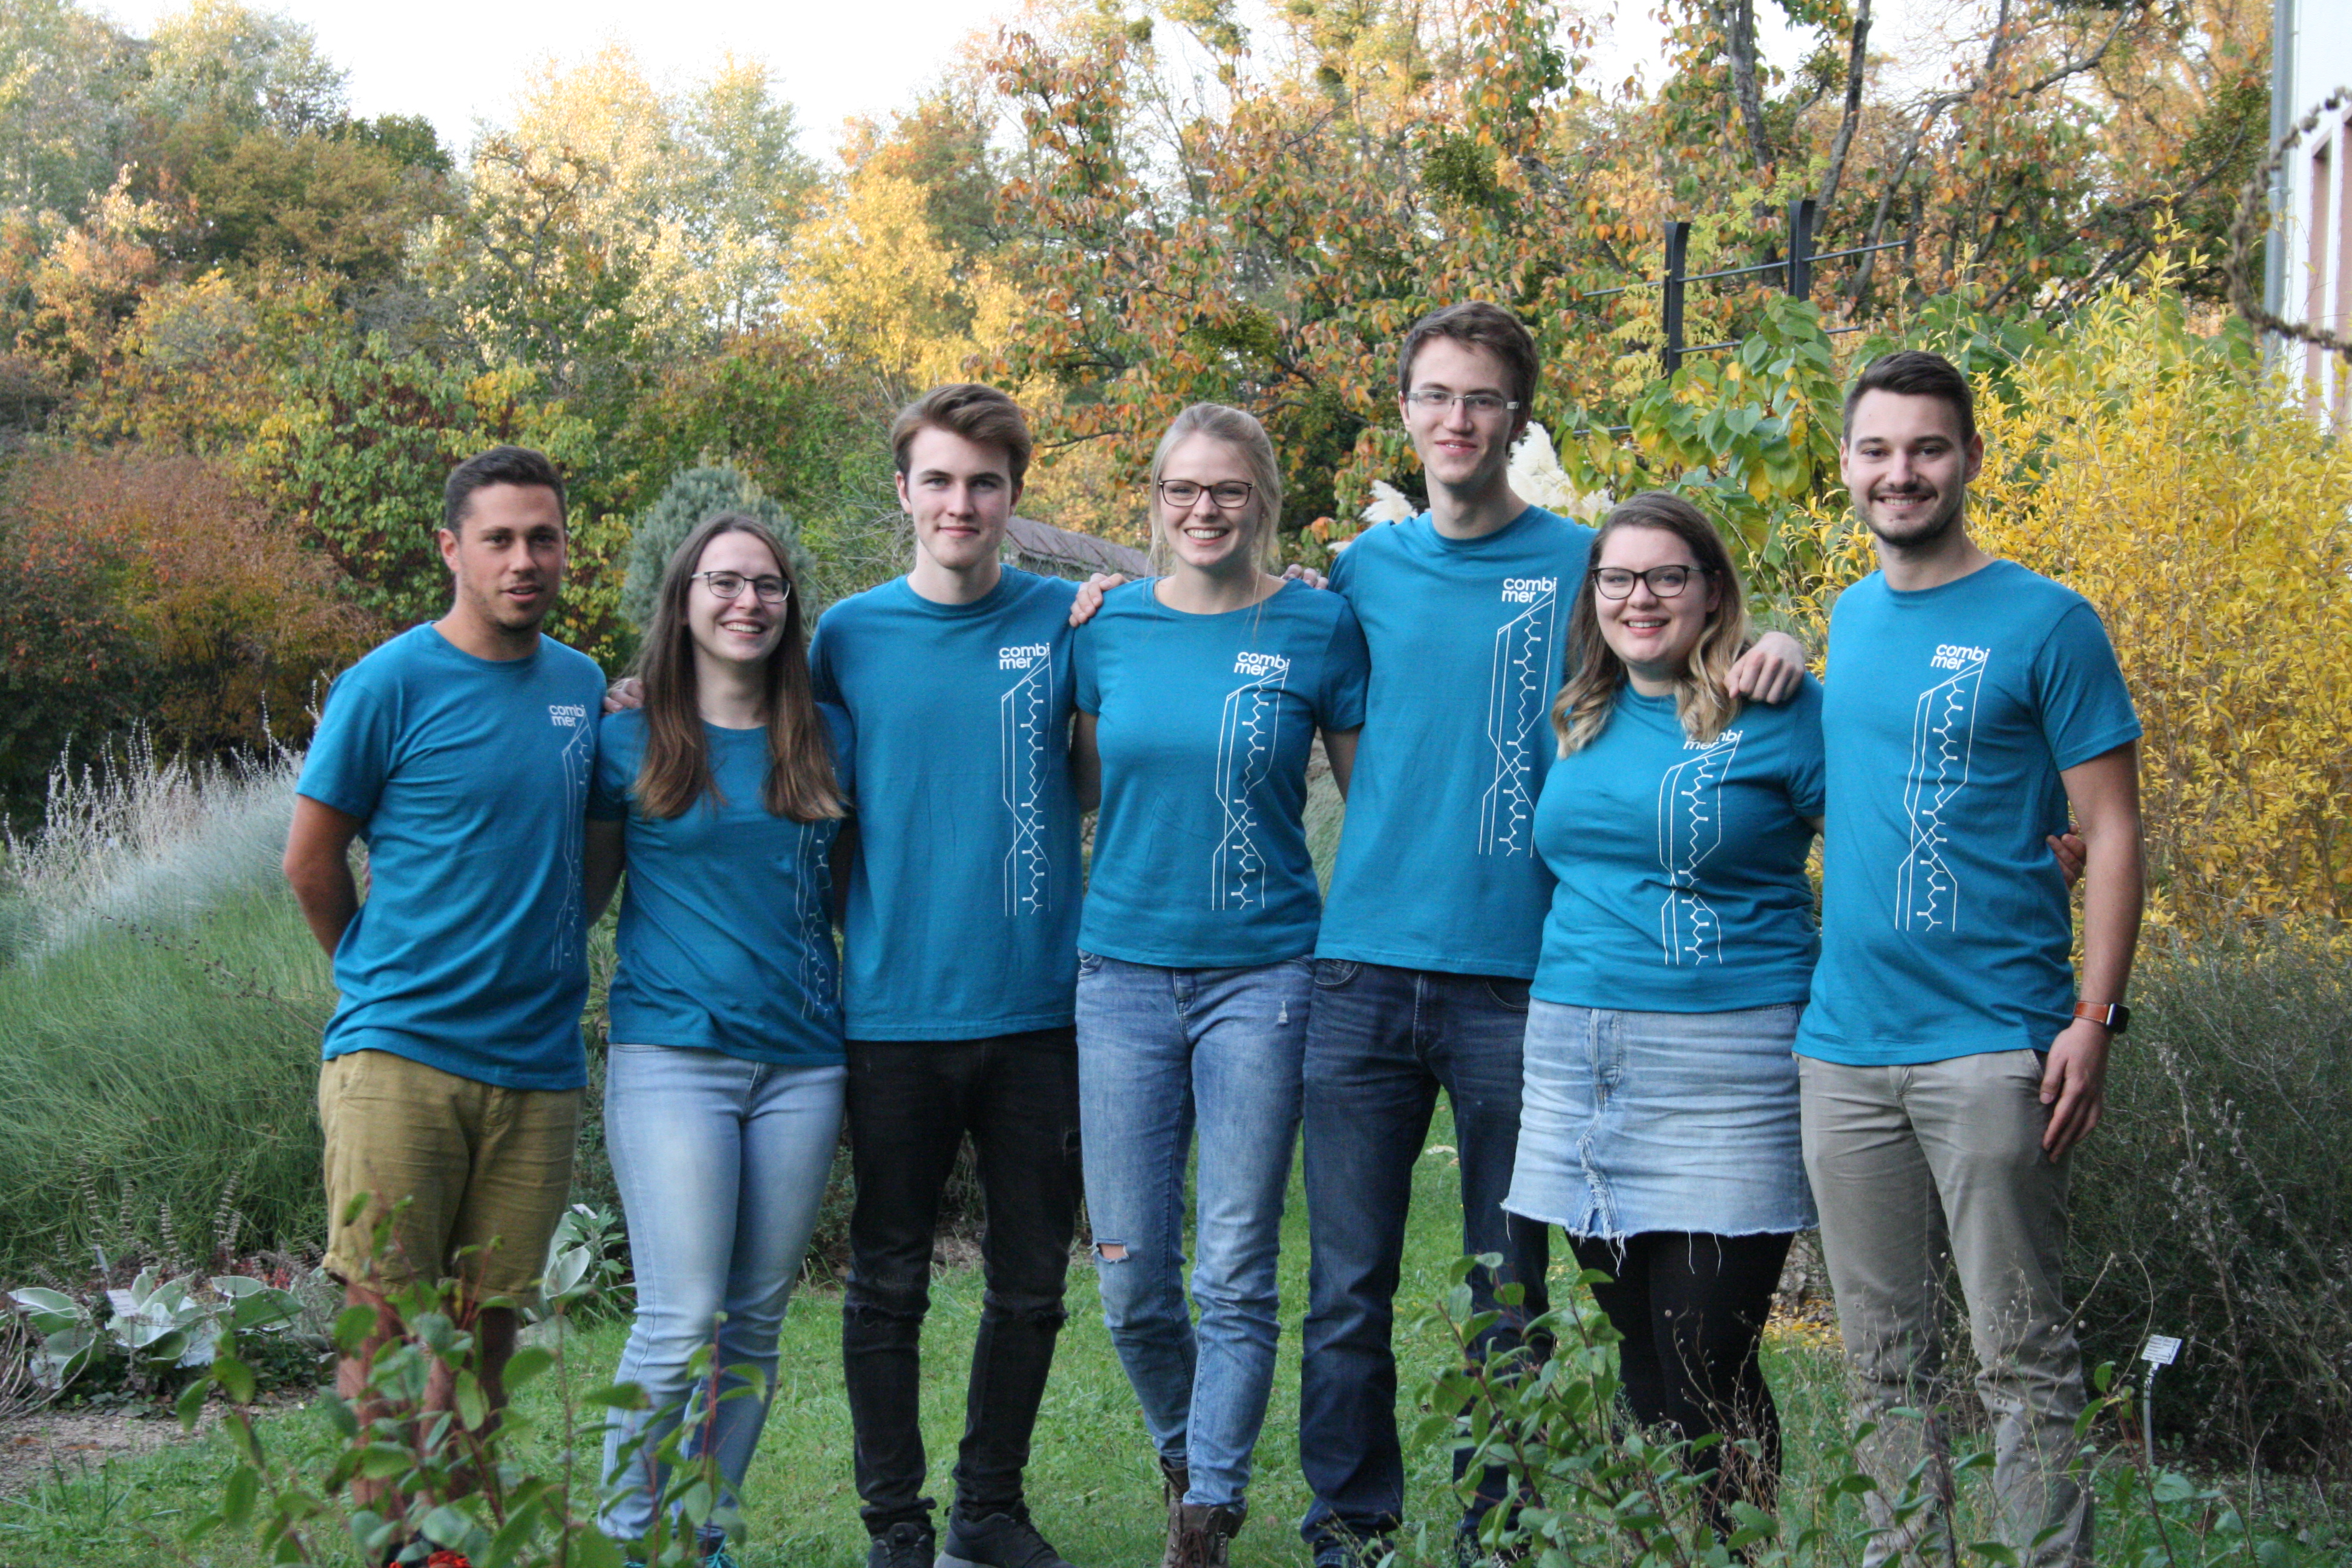
Group picture of the "Yeast" team
From left to right: Victor Macarron Palacios, Elena Nickels, Jonathan Achter, Theresa Wörmann, Christian Hake, Jamina Gerhardus and Yannik Käseberg
References
- ↑ 1.0 1.1 1.2 1.3 1.4 Koivistoinen, O. M., Kuivanen, J., Barth, D., Turkia, H., Pitkänen, J.-P., Penttilä, M., & Richard, P. (2013). Glycolic acid production in the engineered yeasts Saccharomyces cerevisiae and Kluyveromyces lactis. Microbial Cell Factories, 12, 82. [1].
- ↑ Rintala, E., Pitkänen, J., Vehkomäki, M., Penttilä, M., & Ruohonen, L. (2007). The ORF YNL274c (GOR1) codes for glyoxylate reductase in Saccharomyces cerevisiae. Yeast, 24, 129-136.[2].
- ↑ Hoover, G. J., Van Cauwenberghe, O. R., Breitkreuz, K. E., Clark, S. M., Merrill, A. R., & Shelp, B. J. (2007). Characteristics of an Arabidopsis glyoxylate reductase: general biochemical properties and substrate specificity for the recombinant protein, and developmental expression and implications for glyoxylate and succinic semialdehyde metabolism in planta. Canadian Journal of Botany, 85, 883-895. [3].
- ↑ UniProtKB - Q9LSV0 (GLYR1_ARATH), 10/15/2018 [4].
- ↑ ICL1 / YER065C Overview, 10/15/2018 [5].
- ↑ Zahoor, A., Otten, A., & Wendisch, V. F. (2014). Metabolic engineering of Corynebacterium glutamicum for glycolate production. Journal of Biotechnology, 192, 366-375 [6].
- ↑ Zhang, Z., Moo-Young, M., & Christi, Y. (1996). Plasmid stability in recombinant Saccharomyces cerevisiae. Biotechnology Advances, 14(4), 401-435. [7].


