Contents
InterLab Study
Since iGEM is an international competition with many teams from all over the world, it is inevitably coping with the problem of unreproducible scientific measurement results. Multiple teams are measuring fluorescence differently, in different units and are evaluating the results non-identically. Therefore, the InterLab Study aims to develop a standardized protocol for consistent fluorescence measurements of GFP.
Previous studies showed that variability in measurements can be reduced by measuring the GFP expression in absolute fluorescence units calibrated against known fluorescent molecule concentrations. Measurements of cell populations still show high variability caused by the number of cells in the sample. Therefore, it is necessary to determine the mean expression level of GFP per cell to eliminate a source of variability.
This year’s question to be answered was: “Can we reduce lab-to-lab variability in fluorescence measurements by normalizing to absolute cell count or colony-forming units (CFUs) instead of OD?”
Our team followed the standardized procedure guiding us through transformation, inoculation and measurement process. For more information: Fifth International InterLab Measurement Study
Below, this year's results are shown.
Calibration
OD600 Calibration
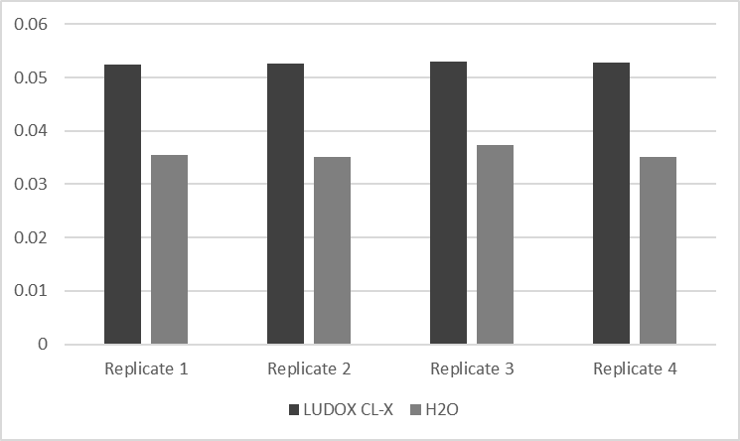
Several measurements of LUDOX-CL-X and H2O were analyzed spectrometricly. The results are shown in table 1 and figure 1.
Table 1: Absorbance measurement of LUDOX-CL-X and H2O of four different replicates.
| LUDOX CL-X | H2O | |
|---|---|---|
| Replicate 1 | 0.0525 | 0.0355 |
| Replicate 2 | 0.0526 | 0.0351 |
| Replicate 3 | 0.0529 | 0.0373 |
| Replicate 4 | 0.0528 | 0.0352 |
| Arithmetic Mean | 0.0528 | 0.0358 |
| Corrected Absorbance 600 | 0.0169 | |
| Reference OD600 | 0.0630 | |
| Correction Factor | 3.7223 |
Defining the correction factor for upcoming experiments allows the conversion of Absorbance 600 from a plate reader into OD600.
Figure 1: Data exported from table 1 into beam chart.
Particle Standard Curve
The absorbance of monodisperse silica microspheres in four replicates in a dilution series were measured in standard modes in our Tecan plate reader (infinite 200Pro).
Table 2: Absorbance at 600 nm measurement of monodisperse silica microspheres in eleven dilutions and one control containing PBS.
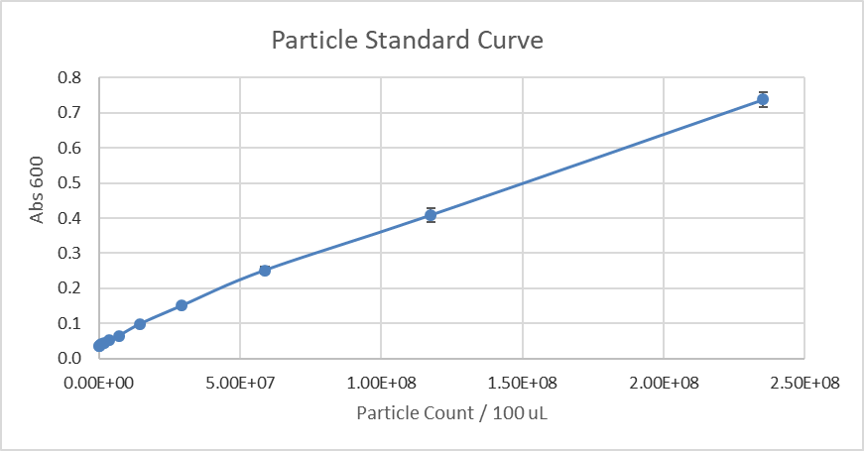
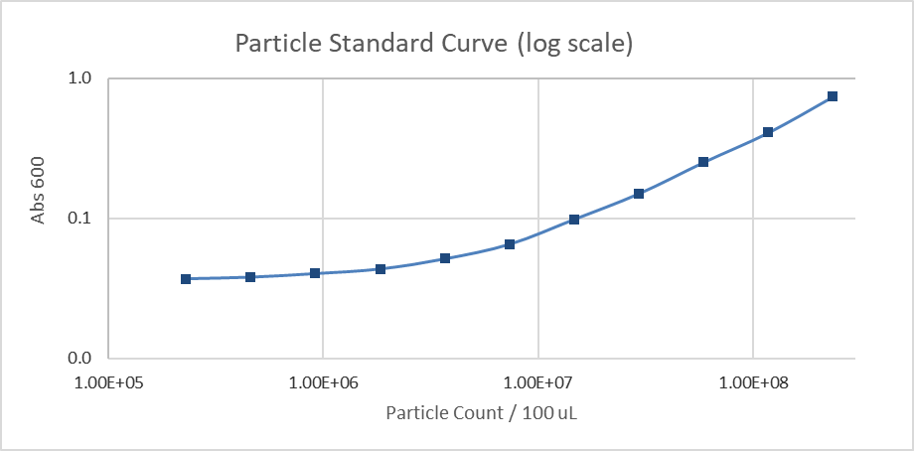
Due to the similarity in size and shape of the microspheres to cells and that there is a known number of particles per volume, the absorbance at 600 nm can be converted to an estimated number of cells for later experiments. The generated standard curve for absorbance of different numbers of particles is shown in figures 2 and 3 in linear and log-scales.
Figure 2: Calibration curve of monodisperse silica microspheres: The absorbance at 600 nm is plotted against the different number of particles.
Figure 3: Calibration curve of monodisperse silica microspheres (log scale): The absorbance at 600 nm is plotted against the different number of particles.
Fluorescein Standard Curve
The fluorescence of fluorescein in four replicates in a dilution series were measured in standard modes in our Tecan plate reader (infinite 200Pro).
Table 3: Fluorescence measurement of fluorescein in eleven dilutions and one control containing PBS. Measurement settings for the plate reader: Excitation 485 nm, Emission 530 nm, 50 gains and 20 flashes.
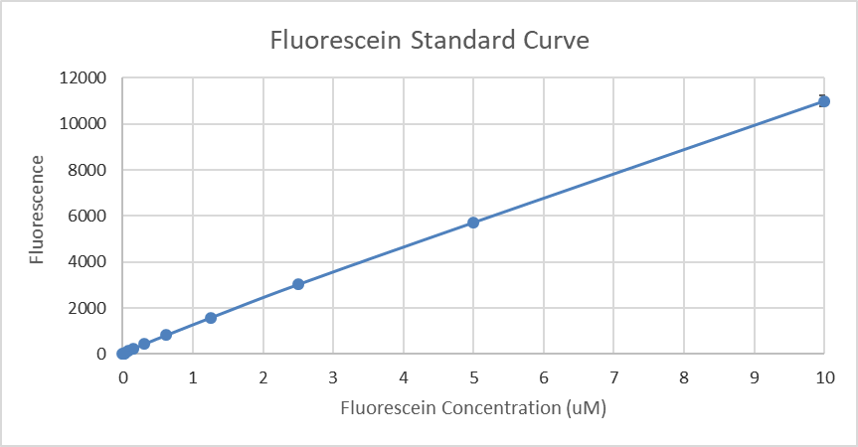
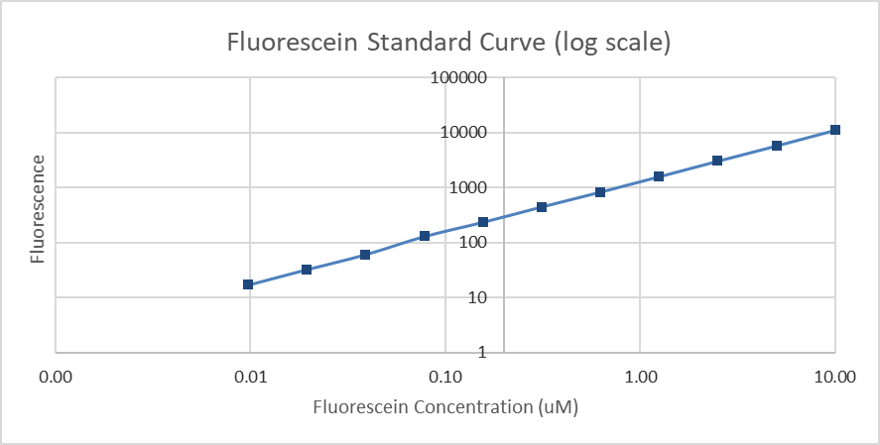
The Generated standard curve of fluorescence for different fluorescein concentrations is shown in figures 4 and 5 in linear and log-scales.
Figure 4: Calibration curve of fluorescein: The resulting fluorescence is plotted against different concentrations (µM).
Figure 5: Calibration curve of fluorescein (log scale): The resulting fluorescence is plotted against different concentrations (µM).
Cell Measurement
Fluorescence and absorbance were measured from six different devices, positive and negative control which are built in pSB1C3 containing chloramphenicol resistance and transformed into E. coli K-12 DH5-alpha. Samples were taken after 0 and 6 hours. ♝
The raw data is shown in table 4 and 5.
µM Fluorescein per OD after 0 and 6 hours
Table 4: Raw data of µM fluorescein per OD from both colonies transformed with negative, positive controls, device 1 to 6 in replicates 1 to 4.
Molecules of Equivalent Fluorescence Level (MEFL) per particle
Table 5: Raw data of MEFL (Molecules of Equivalent Fluorescence Level) per OD from both colonies transformed with negative, positive control, device 1 to 6 in replicates 1 to 4.
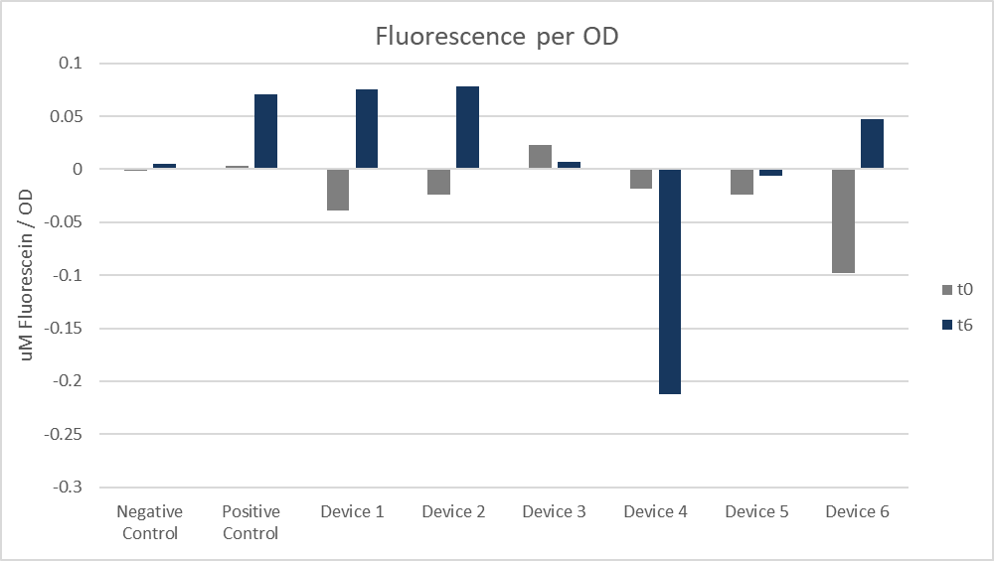
In figure 6 you can see, the positive control showed similar data to cells transformed with devices 1 and 2 and had the highest fluorescence per OD. Devices 4 and 5 showed negative results, but differed from the negative control, which shows positive data.
Figure 6: Fluorescence per OD. Arithmetic mean of both colonies and replicates 1 to 4 at 0 hours and 6 hours.
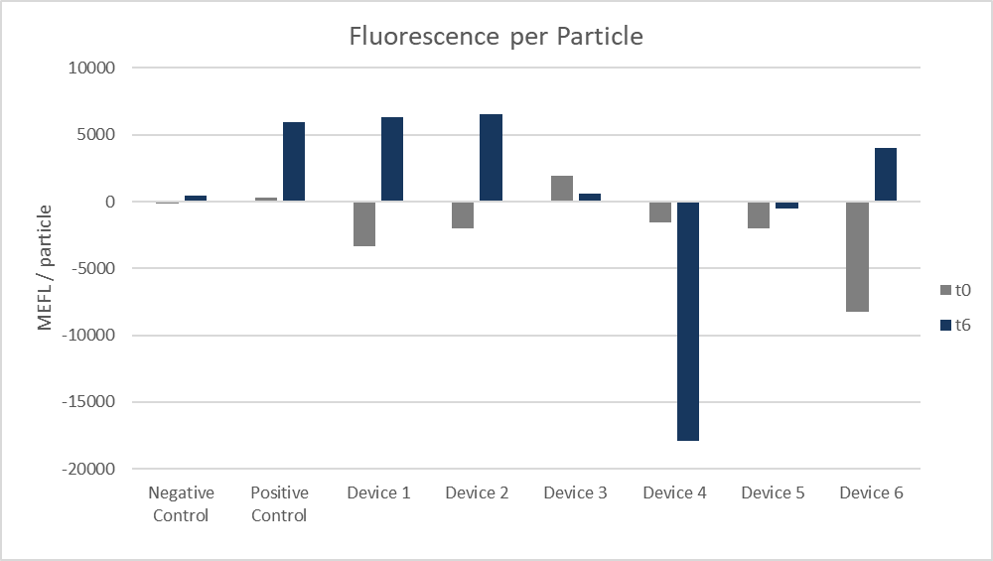
Figure 7: Fluorescence per particle. Arithmetic mean of both colonies and replicates 1 to 4 at 0 hours and 6 hours.
Conclusion
In our cell measurements the data varies widely from colony to colony (Tables 4 and 5). Together with the results of all other participating teams the data will hopefully not vary this widely anymore.
The positive control of our performed cell measurement showed similar data to cells transformed with devices 1 and 2. These exhibited the highest fluorescence per OD of all the other devices. In contrast the devices 4 and 5 showed negative results, but differed from the negative control.
During measurements we differed the gains up to 50 in our plate reader settings. We noticed a much higher fluorescence data which could influence the reproducibility from laboratory to laboratory.
As suggestions for improvement we recommend to put all the information needed for performing the InterLab study in one big file and to be more precise regarding the settings for the plate reader. This may help to develop a standardized protocol for consistent fluorescence measurements all around the world.

