Difference between revisions of "Team:Valencia UPV/Design"
(Prototype team page) |
Carolinarp (Talk | contribs) |
||
| Line 1: | Line 1: | ||
| − | {{Valencia_UPV}} | + | {{Valencia_UPV/bootstrap.css}} |
| + | <!--{{Valencia_UPV/bootstrapMin.css}}--> | ||
| + | {{Valencia_UPV/custom.css}} | ||
| + | {{Valencia_UPV/flickity.css}} | ||
| + | {{Valencia_UPV/iconsmind.css}} | ||
| + | {{Valencia_UPV/jquery.steps.css}} | ||
| + | {{Valencia_UPV/lightbox.min.css}} | ||
| + | {{Valencia_UPV/stackinterface.css}} | ||
| + | {{Valencia_UPV/theme.css}} | ||
| + | {{Valencia_UPV/navBar}} | ||
| + | |||
<html> | <html> | ||
| + | <style> | ||
| − | + | #home_logo, #sideMenu { display:none; } | |
| − | + | #sideMenu, #top_title, .patrollink {display:none;} | |
| − | + | #content { margin-left:0px; margin-top:-30px; padding:0px; width:100%;} | |
| − | + | ||
| − | + | ||
| − | < | + | </style> |
| − | + | ||
| − | + | ||
| − | </ | + | <head> |
| + | <meta charset="utf-8"> | ||
| + | <title>Stack Multipurpose HTML Template</title> | ||
| + | <meta name="viewport" content="width=device-width, initial-scale=1.0"> | ||
| + | <meta name="description" content="Site Description Here"> | ||
| + | <link href="https://fonts.googleapis.com/css?family=Open+Sans:200,300,400,400i,500,600,700%7CMerriweather:300,300i" rel="stylesheet"> | ||
| + | <link href="https://fonts.googleapis.com/icon?family=Material+Icons" rel="stylesheet"> | ||
| + | <link href="https://fonts.googleapis.com/css?family=Lato:400,700,900" rel="stylesheet"> | ||
| + | <link href="https://2018.igem.org/Template:Valencia_UPV/fontAwesome?action=raw&ctype=text/css" rel="stylesheet" type="text/css"> | ||
| − | + | ||
| − | + | </head> | |
| − | < | + | <body class="" style="background-color:#353535;"> |
| − | < | + | <a class="anchorOffset" id="start"></a> |
| − | + | ||
| − | + | ||
| − | </ | + | |
| − | |||
| − | < | + | <!--------- NAVBAR--------------------------------------------------------------------------------------------------------------------------------------------------------------> |
| − | <div class=" | + | |
| − | + | ||
| − | < | + | |
| − | + | ||
| − | < | + | |
| − | + | ||
| − | </ | + | <!------------CONTENEDOR PRINCIPAL ----------------------------------------------------------------------------------------------------------------------------------> |
| + | |||
| + | |||
| + | <div class="main-container"> | ||
| + | |||
| + | <section style="/* background-color: #353535; *//* background-image: url("https://previews.123rf.com/images/bogdanhoda/bogdanhoda1504/bogdanhoda150400014/38730978-test-tubes-in-clinic-pharmacy-and-medical-research-laboratory-with-male-scientist-using-pipette.jpg"); *//* background-size: 100%; */height:44.2em;margin-top: 0em;padding-top: 1.1em;" class="height-90 parallax"> | ||
| + | <div class="main-container" style=" | ||
| + | height: 100%;"> | ||
| + | <center style=" | ||
| + | height: 100%;"> | ||
| + | <div class="col-md-10" style=" | ||
| + | height: 100%;margin-top: 4em;"> | ||
| + | <div id="logoPrinteria" class="item" style=" | ||
| + | background-image: url(http://via.placeholder.com/1155x666); | ||
| + | height: 100%; | ||
| + | width: 100%;background-attachment: fixed; background-position: center; background-position-y: 100px; background-repeat: no-repeat"> | ||
| + | |||
| + | <div style="/* position: absolute; *//* top: 81%; *//* padding-left: 31em; */"> | ||
| + | <a class="btn down inner-link active" href="#story" style="font-size: 82%;/* position: fixed; *//* bottom: 7%; */top: 541px;z-index: 99;background-color: white;position: relative;border-radius: 80%;width: 3.8em;height: 3.8em;padding: 0;padding-top: 14px;"> | ||
| + | <i class="stack-interface stack-down-open-big"></i> | ||
| + | </a> | ||
</div> | </div> | ||
| + | |||
| + | </div> | ||
| + | </div> | ||
| + | |||
| + | </center> | ||
| + | |||
</div> | </div> | ||
| + | |||
| + | |||
| + | |||
| + | </section></div> | ||
| + | <a class="anchorOffset" id="story"></a> | ||
| + | <section class="feature-large" style="padding-top: 6em; padding-bottom: 50px; outline: none;" data-scroll-id="story" tabindex="-1"> | ||
| + | <div class="container"> | ||
| + | <div class="row"> | ||
| + | <div class="col-md-3" style=" | ||
| + | margin-left: 0em; | ||
| + | padding-right: 0px; | ||
| + | padding-left: 0.2em;"> | ||
| + | <div class="tabs-container tabs--vertical page-navigator" style="position: -webkit-sticky;position: sticky;padding-bottom: 0px;margin-top: 11.4em;"> | ||
| + | <h4 style=" | ||
| + | padding-left: 1em; | ||
| + | ">Index</h4> | ||
| + | <ul class="lateral"> | ||
| + | <li class="lateral" style="margin-bottom: 0px;padding-bottom: 1em;padding-top: initial;padding-left: 1em;"> | ||
| + | <div class="tab__title" style=" | ||
| + | line-height: 1.3em; | ||
| + | "> | ||
| + | <a href="#imPrinteria" class="lateral inner-link" style=" | ||
| + | color: #353535; | ||
| + | opacity: 1; | ||
| + | list-style-type: circle; | ||
| + | ">Printeria experiments</a> | ||
| + | </div> | ||
| + | </li> | ||
| + | <li class="lateral"> | ||
| + | <div class="tab__title" style=" | ||
| + | line-height: 1.3em; | ||
| + | "> | ||
| + | <a href="#imCharact" class="lateral inner-link" style=" | ||
| + | color: #353535; | ||
| + | opacity: 1; | ||
| + | ">Parts characterization</a> | ||
| + | </div> | ||
| + | </li> | ||
| + | <li class="lateral"> | ||
| + | <div class="tab__title" style=" | ||
| + | line-height: 1.3em; | ||
| + | "> | ||
| + | <a href="#imSpectral" class="lateral inner-link" style=" | ||
| + | color: #353535; | ||
| + | opacity: 1; | ||
| + | ">Spectral measurements</a> | ||
| + | </div> | ||
| + | </li> | ||
| + | </ul> | ||
| + | <ul class="tabs-content"> | ||
| + | </ul> | ||
| + | </div> | ||
| + | </div> | ||
| + | <div class="col-md-9 col9Attr" style="padding-left: 6em;padding-right: 2em;"> | ||
| + | <div> | ||
| + | <a class="anchorOffset" id="lmExperiments"></a> | ||
| + | <h2 class="h2Experiments">Experiments</h2> | ||
| + | <p> | ||
| + | During the development of Printeria project we have performed different kinds of experiments for different pourposess. First we performed experiments related with the functioning of Printeria itself. (EXPLAIN MORE). Other kind of experiments we performed are the ones necesary to <b>characterize</b> the different parts designed by Printeria. | ||
| + | The experiments we feromed for Printeria can be divided in these 3 classes: | ||
| + | </p> | ||
| + | <ul> | ||
| + | <li><p> | ||
| + | <b>Printeria experiments</b> based on differential equations that describe the biochemical processes of a cell. With them, we can simulate the different genetic circuits that Printeria allows us to build. | ||
| + | </p></li> | ||
| + | <li><p> | ||
| + | <b>Characterizing the parts of our <a href="https://2018.igem.org/Team:Valencia_UPV/Part_Collection" target="_blank">Part Collection</a></b> from the optimization results and provide the user with all the information about the Printeria kit. | ||
| + | </p></li> | ||
| + | <li><p> | ||
| + | <b>Spectral measurements</b> to match simulation results to experimental data obtained from Printeria constructions. | ||
| + | </p></li> | ||
| + | </ul> | ||
| + | <!--BOTONES PARA MOVERSE POR LA PÁGINA --> | ||
| + | <!--Los enlaces están bien pero los ids a donde apuntan están descuadrados adrede para que al pulsar lleve un poco por encima del contenido --> | ||
| + | <div id="" data-scroll-id="" tabindex="-1" style="outline: none;margin-top: 1em;margin-bottom: 1em;justify-content: center;" class="row"> | ||
| + | <div class="col-md-3" style="text-align: center;margin-right: 2em;"> | ||
| + | <a class="inner-link" href="#imPrinteria"><img class="fotosModeling" src="https://static.igem.org/mediawiki/2018/c/ca/T--Valencia_UPV--instagramUPV2018.png"></a> | ||
| + | <p style="text-align: center !important; font-weight: bold;">Printeria experiments</p> | ||
| + | </div> | ||
| + | <div class="col-md-3" style="text-align: center;margin-right: 2em;"> | ||
| + | <a class="inner-link" href="#imCharact"><img class="fotosModeling" src="https://static.igem.org/mediawiki/2018/c/ca/T--Valencia_UPV--instagramUPV2018.png"></a> | ||
| + | <p style="text-align: center !important; font-weight: bold;">Parts characterization </p> | ||
| + | </div> | ||
| + | <div class="col-md-3" style="text-align: center;margin-right: 2em;"> | ||
| + | <a class="inner-link" href="#imSpectral"><img class="fotosModeling" src="https://static.igem.org/mediawiki/2018/c/ca/T--Valencia_UPV--instagramUPV2018.png"></a> | ||
| + | <p style="text-align: center !important; font-weight: bold;">Spectral measurements</p> | ||
| + | </div> | ||
| + | </div> | ||
| + | <!--FIN BOTONES PARA MOVERSE POR LA PÁGINA --> | ||
| + | |||
| + | |||
| + | <div> | ||
| + | <a class="anchorOffset" id="imPrinteria"></a> | ||
| + | <h3>Printeria experiments</h3> | ||
| + | |||
| + | |||
| + | |||
| + | <a class="anchorOffset" id="imCharact"></a> | ||
| + | <h3>Parts characterization</h3> | ||
| + | |||
| + | <a class="anchorOffset" id="exp_protocol"></a> | ||
| + | <h4>Experimental protocol</h4> | ||
| + | <p> | ||
| + | The Printeria Modeling and Lab team and have jointly designed an experimentation protocol for the laboratory experiments. Thanks to it, and from the colonies of the different UT the experimental data can be obtained, processed and ready to be optimized. | ||
| + | </p> | ||
| + | <p><i>Materials:</i></p> | ||
| + | <ul> | ||
| + | <li><a href=""></a> | ||
| + | <p>Printeria transcriptional units</b> (see our Printeria <a href="https://2018.igem.org/Team:Valencia_UPV/Part_Collection" target="_blank">Part Collection</a>)</p> | ||
| + | </li> | ||
| + | <li> | ||
| + | <p>Measuring equipment: <b>Biotek Cytation3</b></p> | ||
| + | </li> | ||
| + | <li> | ||
| + | <p><b>96 well plate</b></p> | ||
| + | </li> | ||
| + | </ul> | ||
| + | <p><i>Protocol:</i></p> | ||
| + | <ol> | ||
| + | <li><p> | ||
| + | A colony or a Glycerol stock corresponding to a TU assembled by our Lab team is used to inoculate LB culture medium (with the appropriate antibiotic, in the cases of the TU, with Kanamycin) and grow overnight at 37ºC and 250 r.p.m. | ||
| + | </p></li> | ||
| + | <li><p> | ||
| + | A 10:1 dilution of the culture is performed changing the culture media to M9 minimal medium and grow for 4 hours at 37ºC and 250 r.p.m. | ||
| + | </p></li> | ||
| + | <li><p> | ||
| + | The culture is chilled in an ice-water bath anfd the optical density at 600nm (OD<sub>600</sub>) of the culture is measured with a spectrophotometer. Then a calculation is performed (using this Excel sheet) to make a dilution in order to bring the OD<sub>600</sub> of the culture to 0.1OD<sub>600</sub> with the appropriate culture volume to inoculate 8 replicas into 200uL wells. | ||
| + | </p></li> | ||
| + | <li><p> | ||
| + | The experiment is designed on the measuring equipment. In our case, we use the Biotek Cytation3 equipment. We establish the equipment parameters. | ||
| + | <table style="width:100%"> | ||
| + | <tr> | ||
| + | <th><p>Parameters</p></th> | ||
| + | <th><p>Description</p></th> | ||
| + | </tr> | ||
| + | <tr> | ||
| + | <td><p>Time</p></td> | ||
| + | <td><p><b>06:00:00 (HH:MM:SS)</b> usually. <b>Measurement interval: 05:00 (MM:SS)</b></p></td> | ||
| + | </tr> | ||
| + | <tr> | ||
| + | <td><p>Number of samples</p></td> | ||
| + | <td><p>We normally set <b>8 samples of reporter protein for each TU colony</b></p></td> | ||
| + | </tr> | ||
| + | <tr> | ||
| + | <td><p>Number of medium samples</p></td> | ||
| + | <td><p>We normally set <b>8 samples of medium</b>. We normally use <b>LB or M9 medium with Kanamycin</b></p></td> | ||
| + | </tr> | ||
| + | <tr> | ||
| + | <td><p>Temperature</p></td> | ||
| + | <td><p>37 ºC</p></td> | ||
| + | </tr> | ||
| + | <tr> | ||
| + | <td><p>Shake</p></td> | ||
| + | <td><p>Double Orbital. Continuously. We shake the plate before each measure</p></td> | ||
| + | </tr> | ||
| + | <tr> | ||
| + | <td><p>Absorbance. Optical Density (OD) measure</p></td> | ||
| + | <td><p>Wavelenght at <b>600 nm</b> emission</p></td> | ||
| + | </tr> | ||
| + | <tr> | ||
| + | <td><p>Excitacion wavelength</p></td> | ||
| + | <td><p>We normally set <b>485 nm</b></p></td> | ||
| + | </tr> | ||
| + | <tr> | ||
| + | <td><p>Emission wavelength</p></td> | ||
| + | <td><p>We normally set <b>528 nm</b></p></td> | ||
| + | </tr> | ||
| + | <tr> | ||
| + | <td><p>Gain (G)</p></td> | ||
| + | <td><p>Normally the gain value is <b>G = 60</b>, although for proteins with lower fluorescence, it is recommended that G takes higher values.</p></td> | ||
| + | </tr> | ||
| + | </table> | ||
| + | </p></li> | ||
| + | <li><p> | ||
| + | Samples are introduced into the 96 well plate and the experiment begins. | ||
| + | </p></li> | ||
| + | <li><p> | ||
| + | After the experiment, fluorescence and absorbance data obtained are exported to an Excel file. | ||
| + | </p></li> | ||
| + | <li><p> | ||
| + | We run the MATLAB <a href="https://static.igem.org/mediawiki/2018/1/13/T--Valencia_UPV--convert_dataUPV2018.txt" target="_blank">convert_data.m</a> script. This script uses several additional MATLAB files with which: | ||
| + | <ol style="list-style-type: lower-latin;"> | ||
| + | <li><p> | ||
| + | We extract the fluorescence and absorbance matrices from the Excel file (see <a href="https://static.igem.org/mediawiki/2018/e/e4/T--Valencia_UPV--readExperiment3UPV2018.txt" target="_blank">readExperiment3.m</a> MATLAB function). | ||
| + | </p></li> | ||
| + | <li><p> | ||
| + | We apply the <a href="#esquema_ops" class="inner-link">corrections</a> to the data (see <a href="https://static.igem.org/mediawiki/2018/3/32/T--Valencia_UPV--plotExperiment_ybUPV2018.txt" target="_blank">plotExperiment_yb.m</a> MATLAB function). | ||
| + | </p></li> | ||
| + | <li><p> | ||
| + | We save the data of FOD, OD, molecules and time in a <b>.mat format</b> file. | ||
| + | </p></li> | ||
| + | </ol> | ||
| + | </p></li> | ||
| + | </ol> | ||
| + | |||
| + | |||
| + | |||
| + | |||
| + | <a class="anchorOffset" id="RBS_exp"></a> | ||
| + | <h7><b>Experiments changing RBS</b></h7> | ||
| + | <p> | ||
| + | We have designed <b>two experiments</b> following the same <a href="#exp_protocol" class="inner-link">experimental protocol</a>. In them we have assembled different Printeria TU with the same promoters, CDS (<a href="http://parts.igem.org/Part:BBa_K2656013" target="_blank">sfGFP</a> reporter protein) and transcriptional terminator, but with <b>different RBS</b>. These experiments were used in our modeling to complete the characterization of the part in the Printeria Collection. | ||
| + | </p> | ||
| + | <a class="anchorOffset" id="RBS_list"></a> | ||
| + | <p><b>Printeria RBS</b>:</p> | ||
| + | <ul> | ||
| + | <li><p> | ||
| + | <b>Strong expression</b>: <a href="http://parts.igem.org/Part:BBa_K2656009" target="_blank" style="padding-right: 0">BBa_K2656009</a>. | ||
| + | </p></li> | ||
| + | <li><p> | ||
| + | <b>Medium expression</b>: <a href="http://parts.igem.org/Part:BBa_K2656011" target="_blank" style="padding-right: 0">BBa_K2656011</a>. | ||
| + | </p></li> | ||
| + | <li><p> | ||
| + | <b>Low expression</b>: <a href="http://parts.igem.org/Part:BBa_K2656010" target="_blank" style="padding-right: 0">BBa_K2656010</a>. | ||
| + | </p></li> | ||
| + | <li><p> | ||
| + | <b>Very low expression</b>: <a href="http://parts.igem.org/Part:BBa_K2656008" target="_blank" style="padding-right: 0">BBa_K2656008</a>, <a href="http://parts.igem.org/Part:BBa_K2656012" target="_blank" style="padding-right: 0">BBa_K2656012</a>. | ||
| + | </p></li> | ||
| + | </ul> | ||
| + | |||
| + | |||
| + | <img src="https://static.igem.org/mediawiki/2018/b/b1/T--Valencia_UPV--optimization_exp1_RBS_graphUPV2018.png"> | ||
| + | <img src="https://static.igem.org/mediawiki/2018/b/b1/T--Valencia_UPV--optimization_exp1_RBS_graphUPV2018.png"> | ||
| + | <img src="https://static.igem.org/mediawiki/2018/b/b1/T--Valencia_UPV--optimization_exp1_RBS_graphUPV2018.png"> | ||
| + | |||
| + | |||
| + | |||
| + | <a class="anchorOffset" id="prom_exp"></a> | ||
| + | <h7><b>Experiments changing promoters</b></h7> | ||
| + | <p> | ||
| + | We have designed <b>two experiments</b> following the same <a href="#exp_protocol" class="inner-link">experimental protocol</a>. In them we have assembled different Printeria TU with the same RBS, CDS (<a href="http://parts.igem.org/Part:BBa_K2656022" target="_blank">GFP</a> reporter protein) and transcriptional terminator, and with <b>different promoters</b>. After obtaining the results, and following the <a href="#optimization" class="inner-link">optimization protocol</a>, we have obtained the parameters of the model and have validated our model. | ||
| + | </p> | ||
| + | <a class="anchorOffset" id="promoter_list"></a> | ||
| + | <p><b>Printeria promoters</b>:</p> | ||
| + | <ul> | ||
| + | <li><p> | ||
| + | <b>Strong promoters</b>: <a href="http://parts.igem.org/Part:BBa_K2656005" target="_blank" style="padding-right: 0">BBa_K2656005</a> | ||
| + | </p></li> | ||
| + | <li><p> | ||
| + | <b>Medium promoters</b>: <a href="http://parts.igem.org/Part:BBa_K2656007" target="_blank" style="padding-right: 0">BBa_K2656007</a> | ||
| + | </p></li> | ||
| + | <li><p> | ||
| + | <b>Low promoters</b>: <a href="http://parts.igem.org/Part:BBa_K2656004" target="_blank" style="padding-right: 0">BBa_K2656004</a> | ||
| + | </p></li> | ||
| + | </ul> | ||
| + | |||
| + | |||
| + | |||
| + | |||
| + | |||
| + | |||
| + | <a class="anchorOffset" id="imSpectral"></a> | ||
| + | <h3>Spectral measurements</h3> | ||
| + | |||
| + | <p> | ||
| + | This year, Valencia UPV iGEM team has designed an extensive <a href="https://2018.igem.org/Team:Valencia_UPV/Part_Collection" target="_blank">Part Collection</a> in purpose of allowing the user to design multiple genetic constructions and experiments. One of our main objectives has been to <b>show the user clear and structured information</b> about the pieces that make up the Printeria kit. For this reason, we have considered the characterization of the parts as a priority when developing the project. In this way, we have elaborated some <b>procedures</b> which have allowed us to systematically obtain and structure information from the parts. | ||
| + | <ul> | ||
| + | <li><p> | ||
| + | <a href="#spectra" class="inner-link">Procedure for obtaining protein spectra</a> | ||
| + | </p></li> | ||
| + | <li><p> | ||
| + | <a href="#comparison" class="inner-link">Comparison between sfGFP and GFP relative fluorescence intensity</a> | ||
| + | </p></li> | ||
| + | </ul> | ||
| + | </p> | ||
| + | |||
| + | <a id="spectra" class="anchorOffset"></a> | ||
| + | <h4>Procedure for obtaining protein spectra </h4> | ||
| + | |||
| + | <p> | ||
| + | Obtaining <b>excitation and emission spectra</b> is a fundamental aspect in the process of characterization of a fluorescent protein. <b>Each protein has a characteristic spectrum</b>, which indicates the energy in which the molecule is excited or emits at a certain wavelength. | ||
| + | </p> | ||
| + | <p> | ||
| + | The characterization of the reporter proteins by excitation and emission spectra are of great importance in experimentation. When contrasting experimental information with the theoretical results of mathematical models, we experiment with numerous reporter proteins, such as fluorescence proteins or chromoproteins. However, the <b>fluorescence data obtained must be corrected applying diferent operations</b> in order to obtain representative fluorescence data: | ||
| + | </p> | ||
| + | <ol style="list-style-type: upper-roman;"> | ||
| + | <li><p> | ||
| + | The subtraction of the medium fluorescence: | ||
| + | <img src="https://static.igem.org/mediawiki/2018/9/97/T--Valencia_UPV--fsubsUPV2018.png"> | ||
| + | </li></p> | ||
| + | <li><p> | ||
| + | The quotient of the fluorescence with the gain: | ||
| + | <img src="https://static.igem.org/mediawiki/2018/b/b0/T--Valencia_UPV--fgainUPV2018.png"> | ||
| + | </li></p> | ||
| + | <li><p> | ||
| + | The quotient of the fluorescence with excitation and emission efficiency: | ||
| + | <img src="https://static.igem.org/mediawiki/2018/2/21/T--Valencia_UPV--fcorrUPV2018.png"> | ||
| + | </li></p> | ||
| + | </ol> | ||
| + | <a id="esquema_ops" class="anchorOffset"></a> | ||
| + | <img src="https://static.igem.org/mediawiki/2018/6/6e/T--Valencia_UPV--esquema_opsUPV2018.png"> | ||
| + | <p> | ||
| + | Until now, the corrections applied to the experiments performed with these reporter proteins were the subtraction of the fluorescence of the medium, and the division by the gain factor of the measuring equipment. However, <b>with the protein spectra we can also normalize the fluorescence data to values that would have been obtained with maximum excitation and emission</b>. | ||
| + | </p> | ||
| + | <p> | ||
| + | Owing to this reason, <b>a protocol has been established</b> in the lab by Lab and Modeling team <b>to obtain the spectrum of any reporter protein</b>. | ||
| + | </p> | ||
| + | <p><i>Materials:</i></p> | ||
| + | <ul> | ||
| + | <li> | ||
| + | <p>Measuring equipment: <b>Biotek Cytation3</b></p> | ||
| + | </li> | ||
| + | <li> | ||
| + | <p><b>96 well plate</b></p> | ||
| + | </li> | ||
| + | <li> | ||
| + | <p><b>MATLAB 2018a software</b></p> | ||
| + | </li> | ||
| + | </ul> | ||
| + | <p><i>Procedure:</i></p> | ||
| + | <ol> | ||
| + | <li><p> | ||
| + | We look for the <a href="https://www.thermofisher.com/es/es/home/life-science/cell-analysis/labeling-chemistry/fluorescence-spectraviewer.html" target="_blank" style="padding-right: 0">theoretical spectra</a> of the protein to be measured or similar molecules in order to determine the wavelength at which the protein is excited or emitted at maximum energy, i.e. where the theoretical spectral peaks occurs. | ||
| + | </p></li> | ||
| + | <li><p> | ||
| + | We define the protocol of our equipment to get the absorbance and fluorescence dataset. In our protocol, the most important parameters to be established are summarized in the following Table. | ||
| + | <table style="width:100%"> | ||
| + | <tr> | ||
| + | <th><p>Parameters</p></th> | ||
| + | <th><p>Description</p></th> | ||
| + | </tr> | ||
| + | <tr> | ||
| + | <td><p>Number of samples</p></td> | ||
| + | <td><p>From <b>3 to 6 samples of reporter protein</b> and <b>3 samples of medium (LB or M9 medium)</b></p></td> | ||
| + | </tr> | ||
| + | <tr> | ||
| + | <td><p>Temperature</p></td> | ||
| + | <td><p>37 ºC</p></td> | ||
| + | </tr> | ||
| + | <tr> | ||
| + | <td><p>Shake</p></td> | ||
| + | <td><p>Double Orbital. 01:00 (MM:SS)</p></td> | ||
| + | </tr> | ||
| + | <tr> | ||
| + | <td><p>Absorbance. Optical Density (OD)</p></td> | ||
| + | <td><p>Wavelenght at <b>600 nm</b> emission</p></td> | ||
| + | </tr> | ||
| + | <tr> | ||
| + | <td><p>Excitacion and emission scans</p></td> | ||
| + | <td><p>The scans occur between <b>two wavelength limit values</b>. The established range will depend on the theoretical spectrum of the protein.</p></td> | ||
| + | </tr> | ||
| + | <tr> | ||
| + | <td><p>Excitacion and emission wavelengths</p></td> | ||
| + | <td><p>These values will depend on the range, and therefore on the spectrum. Values far from the theoretical peak lead to more attenuated fluorescence curves, and values very close to the peak can lead to overlap and error in reading the data. Therefore, <b>a compromise must be reached between curve resolution and reading overlap</b>.</p></td> | ||
| + | </tr> | ||
| + | <tr> | ||
| + | <td><p>Gain (G)</p></td> | ||
| + | <td><p>Normally the gain value is <b>G = 60</b>, although for proteins with lower fluorescence, it is recommended that G takes higher values.</p></td> | ||
| + | </tr> | ||
| + | </table> | ||
| + | </p></li> | ||
| + | |||
| + | <li><p> | ||
| + | The experiment is introduced, and the experimental absorbance data and the fluorescence curves of the samples are obtained with the medium fluorescence correction applied. | ||
| + | </p></li> | ||
| + | |||
| + | <li><p> | ||
| + | The dataset is exported to an Excel file. | ||
| + | </p></li> | ||
| + | |||
| + | <li><p> | ||
| + | The MATLAB script <a href="https://static.igem.org/mediawiki/2018/f/f7/T--Valencia_UPV--spectrummUPV2018.txt" target="_blank">spectrum.m</a> for fluorescent proteins is executed: | ||
| + | <ol style="list-style-type: lower-latin;"> | ||
| + | <li> | ||
| + | <p>Dataset is extracted from the Excel file. We discard readings that have suffered overlap, or that take negative values.</p> | ||
| + | </li> | ||
| + | <li> | ||
| + | <p>The fluorescence curves of all samples are averaged, and the result is normalised (from 0 to 100%).</p> | ||
| + | </li> | ||
| + | <li> | ||
| + | <p>Graphs of the normalized absorption and emission spectra are plotted. The X-axis represents the wavelength (nm), and the Y-axis represents the normalized fluorescence intensity (%).</p> | ||
| + | </li> | ||
| + | </ol> | ||
| + | </p></li> | ||
| + | |||
| + | </ol> | ||
| + | <img src="https://static.igem.org/mediawiki/2018/e/e8/T--Valencia_UPV--sfGFP_spectrumUPV2018.png"> | ||
| + | |||
| + | <p> | ||
| + | In practical terms, the protocol has been applied to all of our reporter proteins: <a href="http://parts.igem.org/Part:BBa_K2656022" target="_blank">GFP</a>, <a href="http://parts.igem.org/Part:BBa_K2656013" target="_blank">sfGFP</a>, <a href="http://parts.igem.org/Part:BBa_K2656021" target="_blank">YFP</a> and <a href="http://parts.igem.org/Part:BBa_K2656014" target="_blank">mRFP</a>. All results can be found in our parts collection as well as in the <a href="http://parts.igem.org/Catalog" target="_blank">iGEM catalog</a>. | ||
| + | </p> | ||
| + | <p> | ||
| + | In the particular case of a reporter chromoprotein, such as <a href="http://parts.igem.org/Part:BBa_K2656018" target="_blank">amilCP</a>, we do not measure fluorescence, but absorbance. In this case, in rder to obtain the corrected absorbance curve, we must subtract from the cell absorbance data with the reporter protein the absorbance of a medium with cells without chromoprotein. Once the data have been corrected, we normalize them between values of 0 and 100 and with this we elaborate the graph. The protocol used can be found in the MATLAB script <a href="https://static.igem.org/mediawiki/2018/8/8b/T--Valencia_UPV--amilCP_spectrumUPV2018.txt" target="_blank">amilCP_spectrum.m</a>. | ||
| + | </p> | ||
| + | <p> | ||
| + | Finally, we have also obtained the spectra of the fluorescein molecule. These spectra have been used to correct the fluorescence data used in the <a href="" target="_blank">Interlab Study</a> to obtain the Relative Fluorescence Units (RFU) to Molecules of Equivalent Fluorochrome (MEFL) conversion factor. In addition, the <a href="#comparison" class="inner-link">comparison</a> between GFP and sfGFP proteins RFU has been possible thanks to fluorescein spectra. | ||
| + | |||
| + | </p> | ||
| + | <table style="width:100%"> | ||
| + | <tr> | ||
| + | <th><p>Parameters</p></th> | ||
| + | <th><p>Value</p></th> | ||
| + | </tr> | ||
| + | <tr> | ||
| + | <td><p>Number of samples</p></td> | ||
| + | <td><p>6 samples. 3 samples of medium (LB or M9 medium)</p></td> | ||
| + | </tr> | ||
| + | <tr> | ||
| + | <td><p>Temperature</p></td> | ||
| + | <td><p>37 ºC</p></td> | ||
| + | </tr> | ||
| + | <tr> | ||
| + | <td><p>Shake</p></td> | ||
| + | <td><p>Double Orbital. 01:00 (MM:SS)</p></td> | ||
| + | </tr> | ||
| + | <tr> | ||
| + | <td><p>Absorbance. Optical Density (OD)</p></td> | ||
| + | <td><p>Wavelenght at <b>600 nm</b> emission</p></td> | ||
| + | </tr> | ||
| + | <tr> | ||
| + | <td><p>Emission range</p></td> | ||
| + | <td><p>[495 - 580] nm</p></td> | ||
| + | </tr> | ||
| + | <tr> | ||
| + | <td><p>Fixed excitation wavelength</p></td> | ||
| + | <td><p>480 nm</p></td> | ||
| + | </tr> | ||
| + | <tr> | ||
| + | <td><p>Excitation range</p></td> | ||
| + | <td><p>[430 - 520] nm</p></td> | ||
| + | </tr> | ||
| + | <tr> | ||
| + | <td><p>Fixed emission wavelength</p></td> | ||
| + | <td><p>545 nm</p></td> | ||
| + | </tr> | ||
| + | <tr> | ||
| + | <td><p>Gain (G)</p></td> | ||
| + | <td><p>60</p></td> | ||
| + | </tr> | ||
| + | </table> | ||
| + | <img src="https://static.igem.org/mediawiki/2018/1/11/T--Valencia_UPV--fluorescein_spectrumUPV2018.png"> | ||
| + | |||
| + | <a id="comparison" class="anchorOffset"></a> | ||
| + | <h4>Comparison between sfGFP and GFP relative fluorescence intensity</h4> | ||
| + | |||
| + | <p> | ||
| + | <b>One of the main problems</b> we encounter when processing the results of experiments <b>in Synthetic Biology are the units of measurement of fluorescence data</b>. Unlike absorbance, where there is a simple conversion between Optical Density (OD) and cell number, <b>there is no direct relationship between the Relative Units of Fluorescence (RFU) and the number of protein molecules in the cell</b>. Moreover, RFUs vary among reporter fluoroproteins: for example, an RFU of the GFP protein does not have to be equivalent to an RFU of the mRFP protein, sfGFP, etc. | ||
| + | </p> | ||
| + | <p> | ||
| + | Thanks to initiatives such as the <a href="" target="_blank">Interlab Study</a>, we have been able to go a step further and obtain a <b>MEFL/cell<sub>GFP</sub> factor</b> of equivalence between the RFU of the <a href="http://parts.igem.org/Part:BBa_K2656022" target="_blank">GFP</a> protein and the Molecules of Equivalent Fluorochrome (MEFL). This relationship is an important breakthrough, as it can give us a more <b>accurate estimation</b> of the amount of GFP molecules in the cell. | ||
| + | </p> | ||
| + | <p> | ||
| + | However, <b>another reporter protein widely used in the experiments is the <a href="http://parts.igem.org/Part:BBa_K2656013" target="_blank">sfGFP</a></b>. This protein has a much faster folding than GFP, which translates into a <b>higher fluorescence intensity per molecule</b>. In order to obtain the MEFL/cell<sub>sfGFP</sub> factor from sfGFP, the Printeria Modeling and Lab teams have designed a <b>comparative experiment between both proteins</b>. The experiment consists of designing <b>two identical transcriptional units (TU), changing only the CDS sequence</b> so that each TU will produce GFP and sfGFP, respectively. It should be added that this experiment is based on <b>two fundamental assumptions</b>: | ||
| + | </p> | ||
| + | <p> | ||
| + | <ol style="list-style-type: upper-latin;"> | ||
| + | <li><p> | ||
| + | The number of GFP molecules produced in the cells is equivalent to the number of MEFL. | ||
| + | </p></li> | ||
| + | <li id="cond_equiv_molec"><p> | ||
| + | Given two TU with identical promoters, RBS and terminators, but with different CDS, under the same experimental conditions, the number of molecules produced by each TU is the same. | ||
| + | </p></li> | ||
| + | </ol> | ||
| + | </p> | ||
| + | <p> | ||
| + | Taking these axioms into account, the materials and procedure followed to calculate the MEFL/cell<sub>sfGFP</sub> factor were as follows. | ||
| + | </p> | ||
| + | <p><i>Materials:</i></p> | ||
| + | <ul> | ||
| + | <li> | ||
| + | <p>Measuring equipment: <b>Biotek Cytation3</b></p> | ||
| + | </li> | ||
| + | <li> | ||
| + | <p><b>96 well plate</b></p> | ||
| + | </li> | ||
| + | <li> | ||
| + | <p><b>MATLAB 2018a software</b></p> | ||
| + | </li> | ||
| + | </ul> | ||
| + | <p><i>Procedure:</i></p> | ||
| + | <ol> | ||
| + | <li><p> | ||
| + | From the fluorescein spectrum, and the fluorescence data obtained from the <a href="" target="_blank">Interlab Study experiment</a>, we apply medium, gain and efficiency <a href="#esquema_ops" class="inner-link">corrections </a>. | ||
| + | </p></li> | ||
| + | <li><p> | ||
| + | The data are introduced in the <a href="" target="_blank">Excel file</a> of the Interlab Study. From the <i>Fluorescein standard curve</i> sheet we can obtain the MEFL/RFU factor, and then calculate the MEFL/cell factor. | ||
| + | <img src="https://static.igem.org/mediawiki/2018/a/af/T--Valencia_UPV--calc_MEFLUPV2018.png"> | ||
| + | <table style="width:100%"> | ||
| + | <tr> | ||
| + | <th><p>Parameters</p></th> | ||
| + | <th><p>Value</p></th> | ||
| + | </tr> | ||
| + | <tr> | ||
| + | <td><p>Cuture volume (96 well plate)</p></td> | ||
| + | <td><p>200 <meta charset="utf-8">μL</p></td> | ||
| + | </tr> | ||
| + | <tr> | ||
| + | <td><p>Cells per <meta charset="utf-8">μL per OD unit</p></td> | ||
| + | <td><p>200 cells/OD <meta charset="utf-8">μ L</p></td> | ||
| + | </tr> | ||
| + | <tr> | ||
| + | <td><p>MEFL/RFU factor</p></td> | ||
| + | <td><p>4,38.10<sup>10</sup> MEFL/RFU</p></td> | ||
| + | </tr> | ||
| + | <tr> | ||
| + | <td><p><b>MEFL/cell<sub>GFP</sub> factor</b></p></td> | ||
| + | <td><p><b>273.7 MEFL OD/RFU cell</b></p></td> | ||
| + | </tr> | ||
| + | </table> | ||
| + | </p></li> | ||
| + | <li><p> | ||
| + | We establish the protocol of the experiment and the parameters of our equipment. The experiment consists in the measurement of the absorbance and fluorescence of <b>two TU with identical promoter, RBS and transcriptional terminator</b>, but whose CDS codifies for <a href="http://parts.igem.org/Part:BBa_K2656105" target="_blank">GFP</a> and <a href="http://parts.igem.org/Part:BBa_K2656101" target="_blank">sfGFP</a> proteins. The most relevant information of the experiment is detailed in the following Table: | ||
| + | <table style="width:100%"> | ||
| + | <tr> | ||
| + | <th><p>Parameters</p></th> | ||
| + | <th><p>Description</p></th> | ||
| + | </tr> | ||
| + | <tr> | ||
| + | <td><p>Time</p></td> | ||
| + | <td><p>06:00:00 (HH:MM:SS). Measurement interval: 05:00 (MM:SS)</p></td> | ||
| + | </tr> | ||
| + | <tr> | ||
| + | <td><p>Number of samples</p></td> | ||
| + | <td><p>8 samples for each TU. Total samples: 16</p></td> | ||
| + | </tr> | ||
| + | <tr> | ||
| + | <td><p>Temperature</p></td> | ||
| + | <td><p>37 ºC</p></td> | ||
| + | </tr> | ||
| + | <tr> | ||
| + | <td><p>Shake</p></td> | ||
| + | <td><p>Double Orbital Continuous</p></td> | ||
| + | </tr> | ||
| + | <tr> | ||
| + | <td><p>Absorbance. Optical Density (OD)</p></td> | ||
| + | <td><p>Wavelenght at <b>600 nm</b> emission</p></td> | ||
| + | </tr> | ||
| + | <tr> | ||
| + | <td><p>Excitacion wavelength</p></td> | ||
| + | <td><p>485 nm</p></td> | ||
| + | </tr> | ||
| + | <tr> | ||
| + | <td><p>Emission wavelength</p></td> | ||
| + | <td><p>528 nm</p></td> | ||
| + | </tr> | ||
| + | <tr> | ||
| + | <td><p>Gain</p></td> | ||
| + | <td><p>60</p></td> | ||
| + | </tr> | ||
| + | </table> | ||
| + | </p></li> | ||
| + | <li><p> | ||
| + | The experiment is introduced into the equipment and the absorbance and fluorescence curves are obtained, as well as the curve of <b>Fluorescence F/Absorbance OD</b> or <b>FOD ratio</b> with the applied medium fluorescence correction. | ||
| + | </p></li> | ||
| + | <li><p> | ||
| + | The absorbance and fluorescence data are exported to an Excel file. | ||
| + | </p></li> | ||
| + | <li><p> | ||
| + | Running the MATLAB <a href="https://static.igem.org/mediawiki/2018/c/c9/T--Valencia_UPV--GPF_sfGFP_comparisonUPV2018.txt" target="_blank">GFP_sfGFP_comparison.m</a> script: | ||
| + | <ol style="list-style-type: lower-latin;"> | ||
| + | <li> | ||
| + | <p>We extract the FOD data from the GFP and sfGFP from the Excel file.</p> | ||
| + | </li> | ||
| + | <li> | ||
| + | <p>We apply the gain and efficiency <a href="#esquema_ops">corrections </a> of the spectrum to the FOD.</p> | ||
| + | </li> | ||
| + | <li> | ||
| + | <p>We plot the FOD curves and look for a stationary equilibrium time interval in the expression of the GFP and sfGFP proteins. In our <a href="#comp_graph" class="inner-link">experiment</a>, we have decided to chose the interval [145,290] min</p> | ||
| + | </li> | ||
| + | <li> | ||
| + | <p>We obtain the average value of both regions.</p> | ||
| + | </li> | ||
| + | <li> | ||
| + | <p>We calculate the number of GFP MEFLs by multiplying the FOD data by the MEFL/cell<sub>GFP</sub> factor.</p> | ||
| + | </li> | ||
| + | <li> | ||
| + | <p>If we assume that the number of molecules expressed by both TU is the same, <a href="#cond_equiv_molec" class="inner-link">the number of MEFL for the calculated GFP is the same as the number of MEFL for the sfGFP</a>.</p> | ||
| + | </li> | ||
| + | <li> | ||
| + | <p>We calculate the MEFL/cell<sub>sfGFP</sub> factor by dividing the MEFL number by the average FOD value of the sfGFP in the stationary region. In our case, MEFL/cell<sub>sfGFP</sub> = 121.4 MEFL·OD/RFU·cell.</p> | ||
| + | </li> | ||
| + | </ol> | ||
| + | </p></li> | ||
| + | </ol> | ||
| + | |||
| + | <a id="comp_graph"></a> | ||
| + | <img src="https://static.igem.org/mediawiki/2018/9/95/T--Valencia_UPV--comp_graphUPV2018.png"> | ||
| + | |||
| + | <table style="width:100%"> | ||
| + | <tr> | ||
| + | <th><p>Reporter protein</p></th> | ||
| + | <th><p>MEFL/cell factor (MEFL·OD/RFU·cell)</p></th> | ||
| + | </tr> | ||
| + | <tr> | ||
| + | <td><p>GFP</p></td> | ||
| + | <td><p>273.7</p></td> | ||
| + | </tr> | ||
| + | <tr> | ||
| + | <td><p>sfGFP</p></td> | ||
| + | <td><p>121.4</p></td> | ||
| + | </tr> | ||
| + | <tr> | ||
| + | </table> | ||
| + | <p> | ||
| + | With MEFL/cell factors, <b>FOD data</b> obtained in any experiment in which GFP or sfGFP was used as reporter proteins <b>can be transformed into equivalent fluorescein molecules</b> by applying the following ratio: <b>Molecules = (MEFL/cell factor) · FOD</b>. | ||
| + | </p> | ||
| + | <p> | ||
| + | The new data give us a more accurate estimation of the number of molecules in the cell. Consequently, by relating the experimental results with the theoretical mathematical models in the <a href="#optimization" class="inner-link">optimization process</a>, the <b>parameters of the model acquire values more consistent with their physical significance</b>, working in equivalent molecules and not in arbitrary units. | ||
| + | </p> | ||
| + | |||
| + | |||
| + | </div> | ||
| + | </div> | ||
| + | </div> | ||
| + | </div> | ||
| + | </div> | ||
| + | </section> | ||
| + | |||
| + | |||
| + | |||
| + | |||
| + | |||
| + | |||
| + | |||
| + | <!--<div class="loader"></div>--> | ||
| + | <a class="back-to-top inner-link" href="#start" data-scroll-class="100vh:active" style="font-size: 82%;"> | ||
| + | <i class="stack-interface stack-up-open-big"></i> | ||
| + | </a> | ||
| + | |||
| + | </body> | ||
| + | |||
| + | |||
| + | <script type="text/javascript" src="https://2018.igem.org/Template:Valencia_UPV/scriptsJS?action=raw&ctype=text/javascript"></script> | ||
| + | <script type="text/javascript" src="https://2018.igem.org/Template:Valencia_UPV/jquery311minJS?action=raw&ctype=text/javascript"></script> | ||
| + | <script type="text/javascript" src="https://2018.igem.org/Template:Valencia_UPV/bootstrapMinJS?action=raw&ctype=text/javascript"></script> | ||
| + | <script type="text/javascript" src="https://2018.igem.org/Template:Valencia_UPV/parallaxJS?action=raw&ctype=text/javascript"></script> | ||
| + | <script type="text/javascript" src="https://2018.igem.org/Template:Valencia_UPV/smoothscrollminJS?action=raw&ctype=text/javascript"></script> | ||
| + | <script type="text/javascript" src="https://2018.igem.org/Template:Valencia_UPV/jquerystepsminJS?action=raw&ctype=text/javascript"></script> | ||
| + | |||
</html> | </html> | ||
| + | |||
| + | {{Valencia_UPV/footer}} | ||
Revision as of 16:36, 9 October 2018

Experiments
During the development of Printeria project we have performed different kinds of experiments for different pourposess. First we performed experiments related with the functioning of Printeria itself. (EXPLAIN MORE). Other kind of experiments we performed are the ones necesary to characterize the different parts designed by Printeria. The experiments we feromed for Printeria can be divided in these 3 classes:
Printeria experiments based on differential equations that describe the biochemical processes of a cell. With them, we can simulate the different genetic circuits that Printeria allows us to build.
Characterizing the parts of our Part Collection from the optimization results and provide the user with all the information about the Printeria kit.
Spectral measurements to match simulation results to experimental data obtained from Printeria constructions.

Printeria experiments
Parts characterization
Spectral measurements
Printeria experiments
Parts characterization
Experimental protocol
The Printeria Modeling and Lab team and have jointly designed an experimentation protocol for the laboratory experiments. Thanks to it, and from the colonies of the different UT the experimental data can be obtained, processed and ready to be optimized.
Materials:
-
Printeria transcriptional units (see our Printeria Part Collection)
-
Measuring equipment: Biotek Cytation3
-
96 well plate
Protocol:
A colony or a Glycerol stock corresponding to a TU assembled by our Lab team is used to inoculate LB culture medium (with the appropriate antibiotic, in the cases of the TU, with Kanamycin) and grow overnight at 37ºC and 250 r.p.m.
A 10:1 dilution of the culture is performed changing the culture media to M9 minimal medium and grow for 4 hours at 37ºC and 250 r.p.m.
The culture is chilled in an ice-water bath anfd the optical density at 600nm (OD600) of the culture is measured with a spectrophotometer. Then a calculation is performed (using this Excel sheet) to make a dilution in order to bring the OD600 of the culture to 0.1OD600 with the appropriate culture volume to inoculate 8 replicas into 200uL wells.
The experiment is designed on the measuring equipment. In our case, we use the Biotek Cytation3 equipment. We establish the equipment parameters.
Parameters
Description
Time
06:00:00 (HH:MM:SS) usually. Measurement interval: 05:00 (MM:SS)
Number of samples
We normally set 8 samples of reporter protein for each TU colony
Number of medium samples
We normally set 8 samples of medium. We normally use LB or M9 medium with Kanamycin
Temperature
37 ºC
Shake
Double Orbital. Continuously. We shake the plate before each measure
Absorbance. Optical Density (OD) measure
Wavelenght at 600 nm emission
Excitacion wavelength
We normally set 485 nm
Emission wavelength
We normally set 528 nm
Gain (G)
Normally the gain value is G = 60, although for proteins with lower fluorescence, it is recommended that G takes higher values.
Samples are introduced into the 96 well plate and the experiment begins.
After the experiment, fluorescence and absorbance data obtained are exported to an Excel file.
We run the MATLAB convert_data.m script. This script uses several additional MATLAB files with which:
We extract the fluorescence and absorbance matrices from the Excel file (see readExperiment3.m MATLAB function).
We apply the corrections to the data (see plotExperiment_yb.m MATLAB function).
We save the data of FOD, OD, molecules and time in a .mat format file.
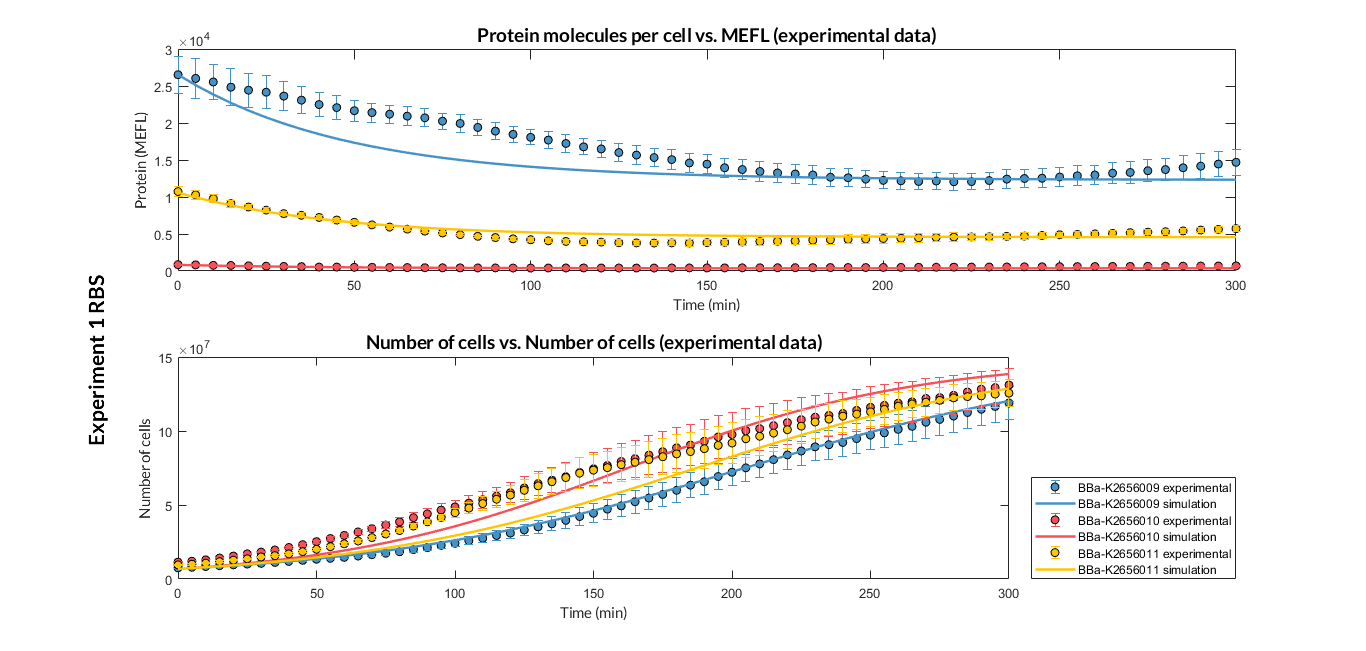
We have designed two experiments following the same experimental protocol. In them we have assembled different Printeria TU with the same promoters, CDS (sfGFP reporter protein) and transcriptional terminator, but with different RBS. These experiments were used in our modeling to complete the characterization of the part in the Printeria Collection.
Printeria RBS:
Strong expression: BBa_K2656009.
Medium expression: BBa_K2656011.
Low expression: BBa_K2656010.
Very low expression: BBa_K2656008, BBa_K2656012.
We have designed two experiments following the same experimental protocol. In them we have assembled different Printeria TU with the same RBS, CDS (GFP reporter protein) and transcriptional terminator, and with different promoters. After obtaining the results, and following the optimization protocol, we have obtained the parameters of the model and have validated our model.
Printeria promoters:
Strong promoters: BBa_K2656005
Medium promoters: BBa_K2656007
Low promoters: BBa_K2656004
Spectral measurements
This year, Valencia UPV iGEM team has designed an extensive Part Collection in purpose of allowing the user to design multiple genetic constructions and experiments. One of our main objectives has been to show the user clear and structured information about the pieces that make up the Printeria kit. For this reason, we have considered the characterization of the parts as a priority when developing the project. In this way, we have elaborated some procedures which have allowed us to systematically obtain and structure information from the parts.
Procedure for obtaining protein spectra
Obtaining excitation and emission spectra is a fundamental aspect in the process of characterization of a fluorescent protein. Each protein has a characteristic spectrum, which indicates the energy in which the molecule is excited or emits at a certain wavelength.
The characterization of the reporter proteins by excitation and emission spectra are of great importance in experimentation. When contrasting experimental information with the theoretical results of mathematical models, we experiment with numerous reporter proteins, such as fluorescence proteins or chromoproteins. However, the fluorescence data obtained must be corrected applying diferent operations in order to obtain representative fluorescence data:
The subtraction of the medium fluorescence:

The quotient of the fluorescence with the gain:

The quotient of the fluorescence with excitation and emission efficiency:


Until now, the corrections applied to the experiments performed with these reporter proteins were the subtraction of the fluorescence of the medium, and the division by the gain factor of the measuring equipment. However, with the protein spectra we can also normalize the fluorescence data to values that would have been obtained with maximum excitation and emission.
Owing to this reason, a protocol has been established in the lab by Lab and Modeling team to obtain the spectrum of any reporter protein.
Materials:
-
Measuring equipment: Biotek Cytation3
-
96 well plate
-
MATLAB 2018a software
Procedure:
We look for the theoretical spectra of the protein to be measured or similar molecules in order to determine the wavelength at which the protein is excited or emitted at maximum energy, i.e. where the theoretical spectral peaks occurs.
We define the protocol of our equipment to get the absorbance and fluorescence dataset. In our protocol, the most important parameters to be established are summarized in the following Table.
Parameters
Description
Number of samples
From 3 to 6 samples of reporter protein and 3 samples of medium (LB or M9 medium)
Temperature
37 ºC
Shake
Double Orbital. 01:00 (MM:SS)
Absorbance. Optical Density (OD)
Wavelenght at 600 nm emission
Excitacion and emission scans
The scans occur between two wavelength limit values. The established range will depend on the theoretical spectrum of the protein.
Excitacion and emission wavelengths
These values will depend on the range, and therefore on the spectrum. Values far from the theoretical peak lead to more attenuated fluorescence curves, and values very close to the peak can lead to overlap and error in reading the data. Therefore, a compromise must be reached between curve resolution and reading overlap.
Gain (G)
Normally the gain value is G = 60, although for proteins with lower fluorescence, it is recommended that G takes higher values.
The experiment is introduced, and the experimental absorbance data and the fluorescence curves of the samples are obtained with the medium fluorescence correction applied.
The dataset is exported to an Excel file.
The MATLAB script spectrum.m for fluorescent proteins is executed:
-
Dataset is extracted from the Excel file. We discard readings that have suffered overlap, or that take negative values.
-
The fluorescence curves of all samples are averaged, and the result is normalised (from 0 to 100%).
-
Graphs of the normalized absorption and emission spectra are plotted. The X-axis represents the wavelength (nm), and the Y-axis represents the normalized fluorescence intensity (%).
-
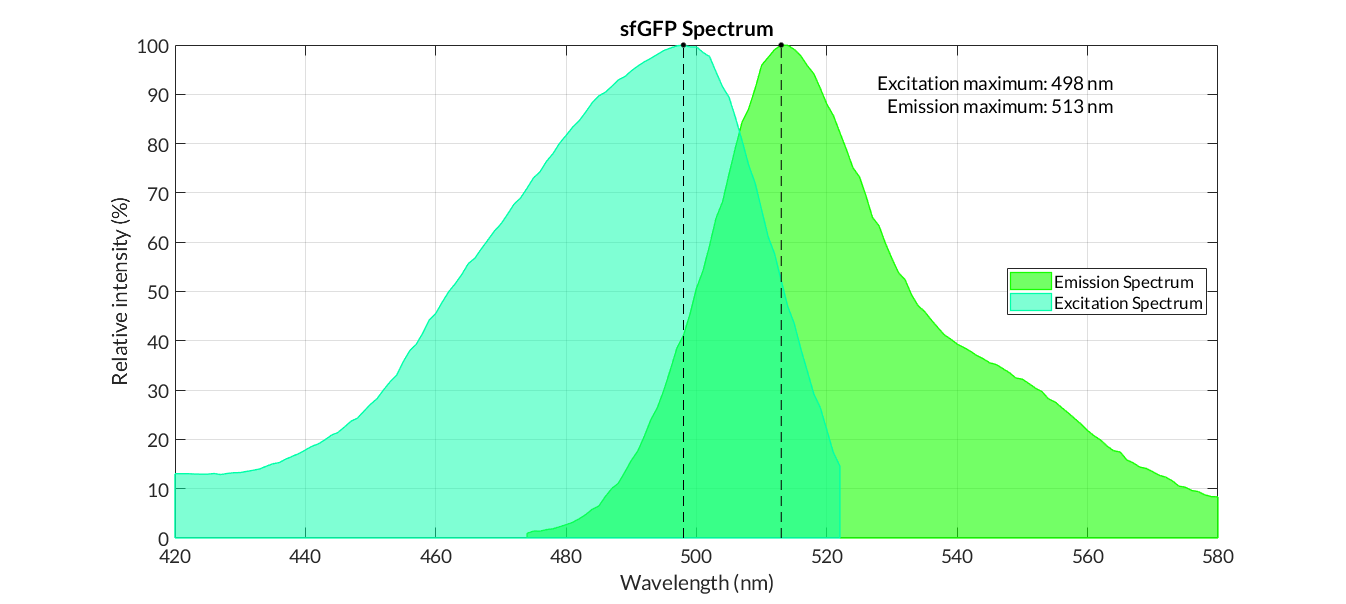
In practical terms, the protocol has been applied to all of our reporter proteins: GFP, sfGFP, YFP and mRFP. All results can be found in our parts collection as well as in the iGEM catalog.
In the particular case of a reporter chromoprotein, such as amilCP, we do not measure fluorescence, but absorbance. In this case, in rder to obtain the corrected absorbance curve, we must subtract from the cell absorbance data with the reporter protein the absorbance of a medium with cells without chromoprotein. Once the data have been corrected, we normalize them between values of 0 and 100 and with this we elaborate the graph. The protocol used can be found in the MATLAB script amilCP_spectrum.m.
Finally, we have also obtained the spectra of the fluorescein molecule. These spectra have been used to correct the fluorescence data used in the Interlab Study to obtain the Relative Fluorescence Units (RFU) to Molecules of Equivalent Fluorochrome (MEFL) conversion factor. In addition, the comparison between GFP and sfGFP proteins RFU has been possible thanks to fluorescein spectra.
Parameters |
Value |
|---|---|
Number of samples |
6 samples. 3 samples of medium (LB or M9 medium) |
Temperature |
37 ºC |
Shake |
Double Orbital. 01:00 (MM:SS) |
Absorbance. Optical Density (OD) |
Wavelenght at 600 nm emission |
Emission range |
[495 - 580] nm |
Fixed excitation wavelength |
480 nm |
Excitation range |
[430 - 520] nm |
Fixed emission wavelength |
545 nm |
Gain (G) |
60 |

Comparison between sfGFP and GFP relative fluorescence intensity
One of the main problems we encounter when processing the results of experiments in Synthetic Biology are the units of measurement of fluorescence data. Unlike absorbance, where there is a simple conversion between Optical Density (OD) and cell number, there is no direct relationship between the Relative Units of Fluorescence (RFU) and the number of protein molecules in the cell. Moreover, RFUs vary among reporter fluoroproteins: for example, an RFU of the GFP protein does not have to be equivalent to an RFU of the mRFP protein, sfGFP, etc.
Thanks to initiatives such as the Interlab Study, we have been able to go a step further and obtain a MEFL/cellGFP factor of equivalence between the RFU of the GFP protein and the Molecules of Equivalent Fluorochrome (MEFL). This relationship is an important breakthrough, as it can give us a more accurate estimation of the amount of GFP molecules in the cell.
However, another reporter protein widely used in the experiments is the sfGFP. This protein has a much faster folding than GFP, which translates into a higher fluorescence intensity per molecule. In order to obtain the MEFL/cellsfGFP factor from sfGFP, the Printeria Modeling and Lab teams have designed a comparative experiment between both proteins. The experiment consists of designing two identical transcriptional units (TU), changing only the CDS sequence so that each TU will produce GFP and sfGFP, respectively. It should be added that this experiment is based on two fundamental assumptions:
The number of GFP molecules produced in the cells is equivalent to the number of MEFL.
Given two TU with identical promoters, RBS and terminators, but with different CDS, under the same experimental conditions, the number of molecules produced by each TU is the same.
Taking these axioms into account, the materials and procedure followed to calculate the MEFL/cellsfGFP factor were as follows.
Materials:
-
Measuring equipment: Biotek Cytation3
-
96 well plate
-
MATLAB 2018a software
Procedure:
From the fluorescein spectrum, and the fluorescence data obtained from the Interlab Study experiment, we apply medium, gain and efficiency corrections .
The data are introduced in the Excel file of the Interlab Study. From the Fluorescein standard curve sheet we can obtain the MEFL/RFU factor, and then calculate the MEFL/cell factor.

Parameters
Value
Cuture volume (96 well plate)
200 μL
Cells per μL per OD unit
200 cells/OD μ L
MEFL/RFU factor
4,38.1010 MEFL/RFU
MEFL/cellGFP factor
273.7 MEFL OD/RFU cell
We establish the protocol of the experiment and the parameters of our equipment. The experiment consists in the measurement of the absorbance and fluorescence of two TU with identical promoter, RBS and transcriptional terminator, but whose CDS codifies for GFP and sfGFP proteins. The most relevant information of the experiment is detailed in the following Table:
Parameters
Description
Time
06:00:00 (HH:MM:SS). Measurement interval: 05:00 (MM:SS)
Number of samples
8 samples for each TU. Total samples: 16
Temperature
37 ºC
Shake
Double Orbital Continuous
Absorbance. Optical Density (OD)
Wavelenght at 600 nm emission
Excitacion wavelength
485 nm
Emission wavelength
528 nm
Gain
60
The experiment is introduced into the equipment and the absorbance and fluorescence curves are obtained, as well as the curve of Fluorescence F/Absorbance OD or FOD ratio with the applied medium fluorescence correction.
The absorbance and fluorescence data are exported to an Excel file.
Running the MATLAB GFP_sfGFP_comparison.m script:
-
We extract the FOD data from the GFP and sfGFP from the Excel file.
-
We apply the gain and efficiency corrections of the spectrum to the FOD.
-
We plot the FOD curves and look for a stationary equilibrium time interval in the expression of the GFP and sfGFP proteins. In our experiment, we have decided to chose the interval [145,290] min
-
We obtain the average value of both regions.
-
We calculate the number of GFP MEFLs by multiplying the FOD data by the MEFL/cellGFP factor.
-
If we assume that the number of molecules expressed by both TU is the same, the number of MEFL for the calculated GFP is the same as the number of MEFL for the sfGFP.
-
We calculate the MEFL/cellsfGFP factor by dividing the MEFL number by the average FOD value of the sfGFP in the stationary region. In our case, MEFL/cellsfGFP = 121.4 MEFL·OD/RFU·cell.
-

Reporter protein |
MEFL/cell factor (MEFL·OD/RFU·cell) |
|---|---|
GFP |
273.7 |
sfGFP |
121.4 |
With MEFL/cell factors, FOD data obtained in any experiment in which GFP or sfGFP was used as reporter proteins can be transformed into equivalent fluorescein molecules by applying the following ratio: Molecules = (MEFL/cell factor) · FOD.
The new data give us a more accurate estimation of the number of molecules in the cell. Consequently, by relating the experimental results with the theoretical mathematical models in the optimization process, the parameters of the model acquire values more consistent with their physical significance, working in equivalent molecules and not in arbitrary units.