JonathanFu (Talk | contribs) |
JonathanFu (Talk | contribs) |
||
| Line 17: | Line 17: | ||
<b><sup>1</sup>H-NMR and coupling:</b> | <b><sup>1</sup>H-NMR and coupling:</b> | ||
| − | In <sup>1</sup>H-NMR-Spectroscopy chemists are looking at the resonance of | + | In <sup>1</sup>H-NMR-Spectroscopy chemists are looking at the resonance of <sup>1</sup>H protons, which is the most common isotope of Hydrogen. Resonating hydrogen atoms can interfere with each other, which leads to a splitting of the signal in the spectrum. This special interference is referred to as coupling and gives even greater insight to the chemical structure of a sample. |
[[image:T--TU_Darmstadt--1H NMR spectrum.png|500px |alt=Text|Figure 2 illustration of the coupling 1H resonance in a 1H-NMR spectrum. This is giving even further insight into the chemical structure of the component]] | [[image:T--TU_Darmstadt--1H NMR spectrum.png|500px |alt=Text|Figure 2 illustration of the coupling 1H resonance in a 1H-NMR spectrum. This is giving even further insight into the chemical structure of the component]] | ||
Revision as of 17:32, 13 October 2018
Contents
Analysis
NMR-Spectroscopy
Introduction:
NMR-Spectroscopy (nuclear magnetic resonance) is a widely used and versatile analysis to predict the chemical structure of a sample. The method works by placing a sample in a strong magnetic field and exposed to radio waves with different frequencies. Some atomic nuclei will start to resonate as they interact with the radio waves of a certain frequency. The frequency at which the nuclei resonate in respect to the radio waves is determined by the chemical shift of the atom. The chemical shift describes the amount of shielding a nucleus experiences from its surrounding electrons. Nuclei that have a low electron density have a strong chemical shift and therefore resonate at higher frequencies. Thus they appear on the left hand side of the spectrum. The opposite is true for atoms with a weak chemical shift. If groups in a chemical substance have identical surroundings, they appear as a single signal in the spectrum. The integral of the signal tells us how many identical groups correspond to the signal.
1H-NMR and coupling:
In 1H-NMR-Spectroscopy chemists are looking at the resonance of 1H protons, which is the most common isotope of Hydrogen. Resonating hydrogen atoms can interfere with each other, which leads to a splitting of the signal in the spectrum. This special interference is referred to as coupling and gives even greater insight to the chemical structure of a sample.
Gel permeation chromatography
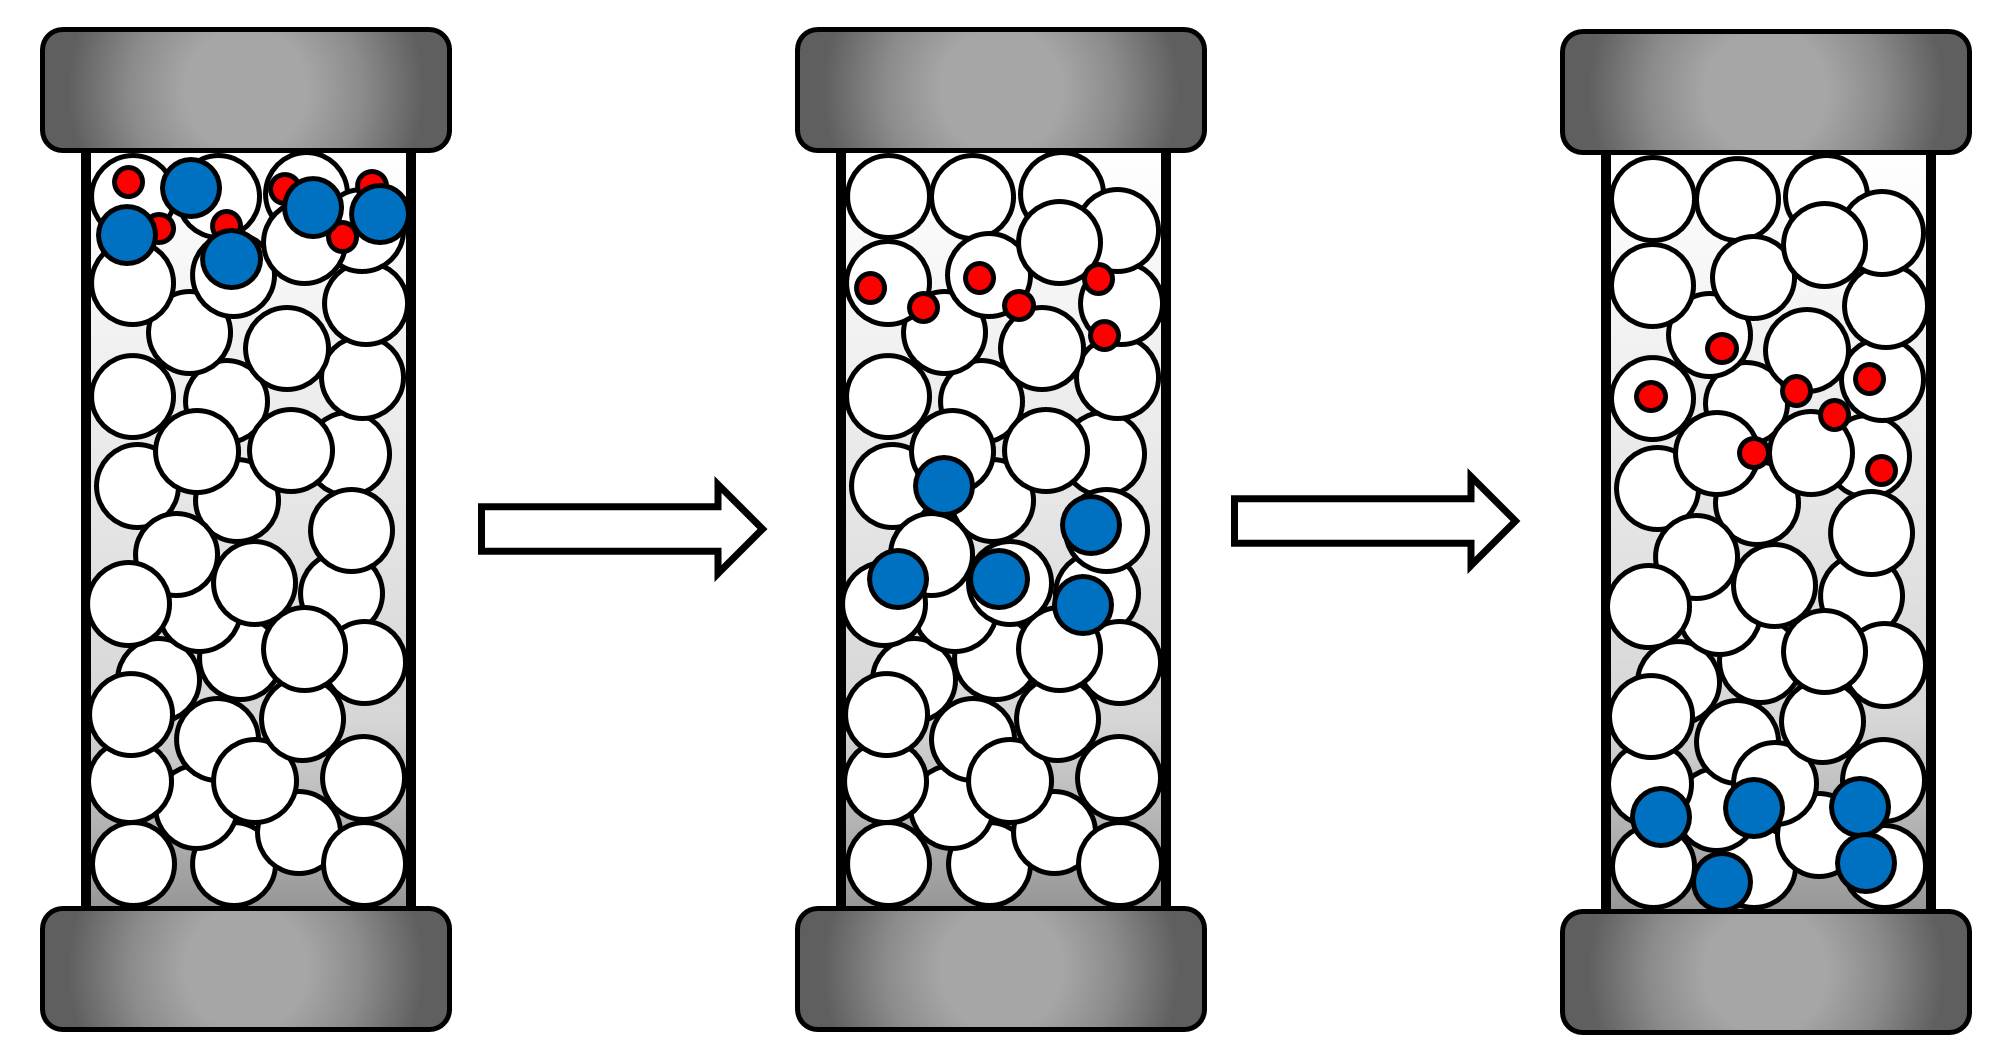
To determine the length of the polymer chains, the gel permeation chromatographic (GPC) turned out to be the method of choice. A pump pulls a sample of the polymer, solved in an eluent through a column, filled with a packing material of various pore sizes. The velocity of the polymer is depending on its size, bigger polymers flow faster than smaller polymers. At the end of the column is a detector (DLS or UV/Vis) measuring the amount of substance coming out of the column in dependence of time. The results are then compared to standard samples and give the information of the molecular weight and through that the length of the polymers.
3 mg of our samples were solved in 1 ml of a Toluene-THF-buffer. To help the sample dissolving completely, the vessel is closed and put in an ultrasonic bath until there are no suspended particles visible. To remove all unsolved particles, the solution is pulled up into a syringe and pushed through a filter put on top of the syringe. This step is essential, because unsolved particles threaten to block the column of the GPC. Than our samples are compared to a Polystyrene standard sample and through that the molecular weight and the length of the polymer are determined.
Dynamic light scattering and photocorrelation spectroscopy
Dynamic light scattering and photon correlation spectroscopy
Introduction:
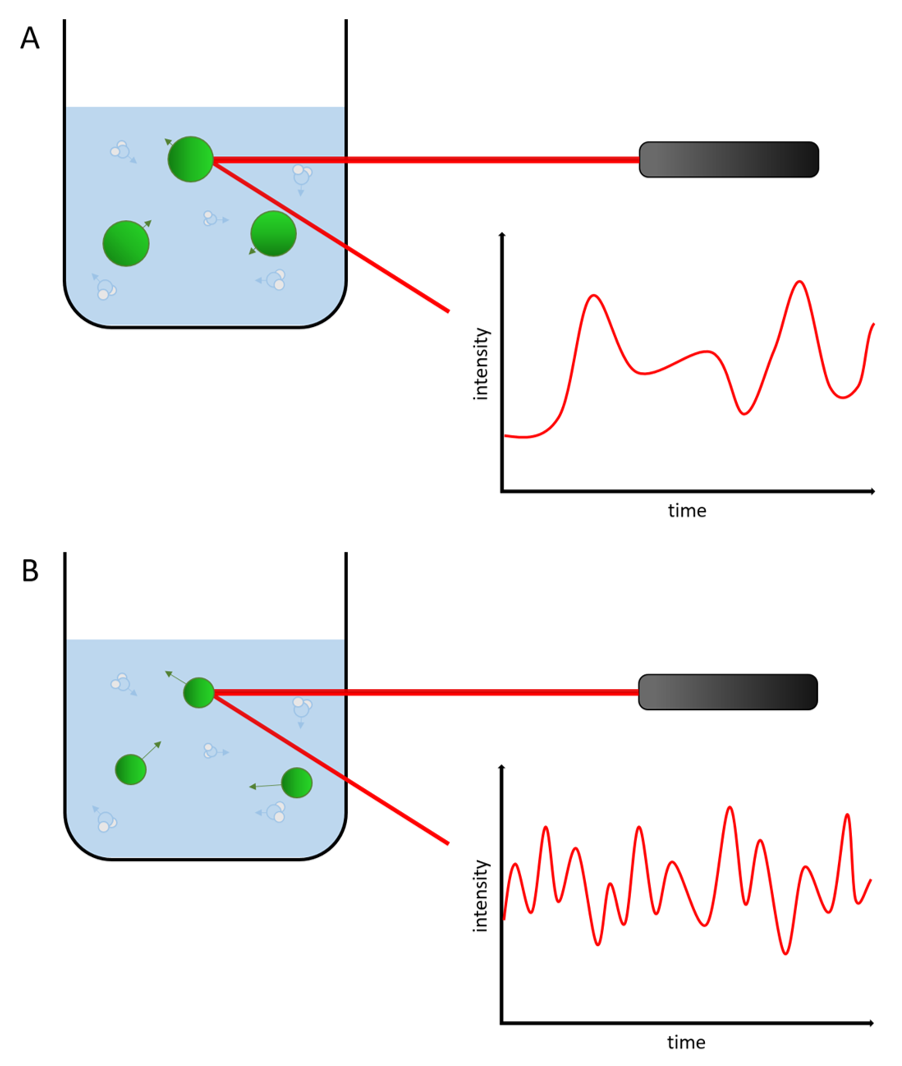
Dynamic light scattering is a commonly used method in physics to detemine the size distribution of particles and polymers in a solution. By scattering light from small particles, their geometrical structure and their state of motion can be measured. Dynamic light scattering (DLS) is used to analyse particles undergoing Brownian motion in photon correlation spectroscopy to get insights about the particle size. Correlation of particle size and Brownian motion The Brownian motion of particles is strongly correlated to the size of particles. Understanding this correlation is crutial for the understanding of light scattering spectroscopy. The reason for Brownian motion is the thermal motion of solvent molecules, which transfer their momentum onto the suspended particles when they are colliding. Those momenta do not always cancel out, which results in a net movement of the suspended particle. The particle flow is described by Fick’s first law of diffusion, which also considers concentration gradients. We did our measurements under equilibrated conditions and assume that there are no concentration gradients present. For this reason we are only concerned with the diffusion coefficient which is the proportionality factor of Fick’s first law (Equation 1).
EQUATION HERE!!!!
Measurement:
The photon correlation spectroscopy interprets the dynamic light scattering of the suspended particles while taking the size depended Brownian motion into consideration. Small, fast moving particles give different patterns during the spectroscopy than bigger, slow moving particles. This way it is possible to get a precise statement about the particle size distribution.
Confocal microscopy
Confocal microscopy theory
Confocal microscopy is an imaging technique where only a single plane of the sample is illuminated, therefore just one layer and not the whole sample is visible. The light scans horizontally over the sample to give a 2D image of the sample. The light irradiates on a pinhole in front of the detector, which minimizes out of focus signals resulting in a high contrast picture. The following figure directly compares a confocal microscopy image with a traditional light microscope, where the complete sample is illuminated at a time.


