Team:Manchester/InterLab
The Fifth InterLab Study
Measurement of GFP fluorescence is a useful tool for quantifying gene expression. When carrying out this type of work, researchers often wish to state their data as a measurement of fluorescence per cell. Currently, the fluorescence per cell measurement can be variable due to differences between:
units of measurement
data processing settings
device model
To find fluorescence per cell values, typically the measured fluorescence is divided by the OD600 as an approximation of a cell number. This can also be imprecise and variable when measured on different devices.
The aim of the Fifth InterLab study is to make fluorescence per cell measurements more compatible among various laboratories around the world by investigating the fluorescence of eight test devices built from BioBrick parts. By standardising the protocol for the plate reader calibration with LUDOX solution, silica beads, and fluorescein, we hope to reduce variability between our results and those of other iGEM teams. OD600 values will be associated with colony forming units (CFUs) to achieve a more accurate measurement of fluorescence per cell.
Protocols
All InterLab protocols were provided by iGEM
Calibration
Calibration 1: OD600 Reference point - LUDOX Protocol
LUDOX CL-X was used as a single reference point for the plate reader calibration. Using the correction factor obtained from the data, absorbance (Abs600) values from the plate reader were converted into a comparable OD600 measurement and so the variability between path lengths was avoided.
400 μl of the LUDOX solution was added into four separate wells (100 μl each) in the 96-well plate. The same was done with 400 μl of the ddH2O. OD600 measurements were taken and the correction factor of 3.190 was obtained, see the table with results below:

Calibration 2: Particle Standard Curve - Microsphere Protocol
Silica beads - Microsphere suspension was used to construct a standard curve of a particle concentration that was instrumental in estimating the amount of particles/cells from the OD600 measurement.
To prepare a Silica beads stock solution, microsphere suspension was vigorously vortexed for 30 seconds and 96 μl was quickly transferred into 1.5 ml eppendorf tube and diluted up to 1 ml with ddH2O. A set of ten 2-fold serial dilutions in ddH2O was performed.
The OD600 measurements were taken, see the table with results below:

Calibration 3: Fluorescence standard curve - Fluorescein Protocol
The units of fluorescence detected depend on the apparatus used and so to compare results from different teams, a standard curve should be made. To do that, all teams used the same fluorescein molecule to take measurements and construct a curve.
To prepare a 10x fluorescein solution, the tube with fluorescein powder (100 μM dried down) was centrifuged for 30 s at 775 xg and resuspended in 1 ml 1x PBS. Then, 1x fluorescein stock was made by mixing 100 μl of 10x fluorescein solution with 900 μl of 1x PBS. The set of ten 2-fold serial dilutions in 1x PBS was performed.
The fluorescence was measured, see the results below:

Plates used (Corning Incorporated Costar 3603)
96-well plate, black with clear and flat bottom.

Plate reader (BMG LabTech Clariostar ) settings
OD600
All OD600 measurements were taken using the same settings:
27 °C
Path length correction off
35 flashes per well
Double orbital shaking mode with the frequency of 400 rpm for 10s before reading
Fluorescence
All fluorescence measurements were taken using the same settings:
27 °C
Bottom optics
Excitation wavelength 485-15 nm
Emission wavelength 525-15 nm
Well scan with orbital averaging of 3
25 flashes per well
The gain setting 1500
Focal height 4.8
Double orbital shaking mode with the frequency of 500 rpm for 10s before reading
- Cell measurement -
E.coli DH5 α transformation
To transform cells with different devices, 25 μl of E.coli DH5 α competent cells were mixed with 1 μl of DNA which has been resuspended with 10 μl ddH2O from DNA distribution kit plates. Cells were kept on ice for 30 min, heat shocked at 42°C for 45 s followed by 5 min incubation on ice. Later, 450 μl of LB medium was added and cells were incubated for 60 min at 37°C with shaking. 100 μl of transformed cells were plated on LB Agar plates containing 34 μg/ml of chloramphenicol (Cam).
Parts used to transform cells:
Plate 1: BBa_R0040 (Negative Control)
Plate 2: BBa_I20270 (Positive Control)
Plate 3: BBa_J364000 (Test Device 1)
Plate 4: BBa_J364001 (Test Device 2)
Plate 5: BBa_J364002 (Test Device 3)
Plate 6: BBa_J364007 (Test Device 4)
Plate 7: BBa_J364008 (Test Device 5)
Plate 8: BBa_J364009 (Test Device 6)
The next day, two colonies from each plate were inoculated into 10 ml LB+Cam and grown for 18 hours at 37°C and 220 rpm.
Cell assay
10-fold dilutions were made with each of the overnight cultures with LB+Cam, and Abs600 was measured with a spectrophotometer (Eppendorf BioSpectrometer basic). Colonies were diluted with LB+Cam to target Abs600 of 0.02 in a final volume of 12 ml. A 500 μl sample from each diluted culture was taken prior to incubation and put on ice. Remaining cultures were incubated for 6 h at 37°C with shaking. After 6h of incubation, 500 μl samples from each tube were taken for analysis.
100 μl of each sample in four technical replicates were pipetted into separate wells of a 96-well plate. OD600 and fluorescence measurements were taken.

Figure 1. Plate layout used for fluorescence and OD600 measurements.
Colony Forming Units per OD600= 0.1 and Results
25 μl of the overnight culture of colonies picked from plates 1 and 2 were each separately mixed with 175 μl of LB+Cam in a 96-well plate and OD600 was measured (Table 1.).
Table 1. 8-fold dilutions of overnight cultures were done and the OD600 measurements were performed (200 μl of each dilution) with a plate reader. Plate 1 - negative control; plate 2 - positive control.

Table 2. OD600 measurements of each overnight culture dilution (each in 3 technical triplicates) to target OD600 = 0.1. 200 μl of each dilution was measured on a plate reader.

The set of three 20-fold and two 10-fold serial dilutions was performed with samples 1.1 - 4.3 and 100 μl of the last three dilutions were plated on LB Agar + Cam (34 μg/ml) plates and incubated overnight at 37°C.
The next day, colonies were counted in each plate and the following results were obtained (Table 3.).
Table 3. The number of colonies counted in each plate with the dilution factor of 8×10⁵

Results and Conclusions

Figure 2. Plate reader results. Average OD600 measurements of E.coli DH5 α cells transformed with different devices and grown in LB + Cam in 37°C (for 6h time point). Error bars represent SD values (n=4, technical replicates).
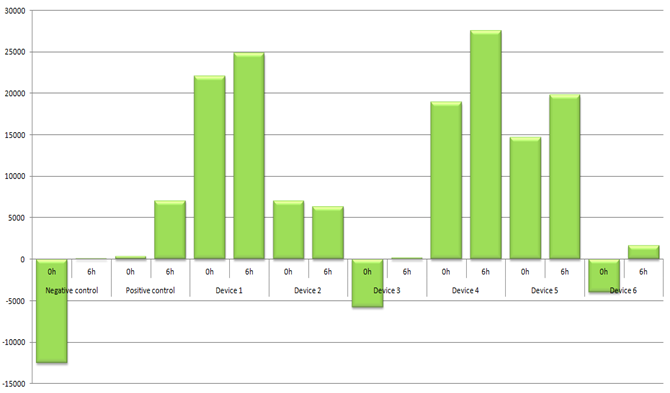
Figure 3. Average raw fluorescence data over average OD600 presented (n=4, technical replicates). To record the data at 6h time point, cells were grown in LB + Cam in 37°C (with shaking).
Overall, most of our results of the InterLab study are as expected. Cultures grew over the 6h period reaching the OD600 values of 0.214 - 0.475 with an exception of the Device 5 which grew very little (OD600 = 0.072) (Fig. 2). This might be because cells died after some time of incubation. Having more time, we could measure the cell growth over time and find the time point where the OD600 values level off. Also, parallel to this we could transform some E.coli DH5 α cells with a plasmid containing only Cam resistance to see if the expression of GFP is fatal/toxic to cells. Another reason could be that the DNA plasmid of Device 5 was poor quality or had a mutation making cells less resistant to Cam. As a result, cells did not survive in LB media with antibiotic.
According to the raw fluorescence data analysis with the GraphPad Prism 7.04 software, all our samples were significantly more fluorescent after 6h of incubation than at the 0h time point including positive control being significantly more fluorescent than the negative (Table 4.).

Table 4. P values were obtained after performing a paired t-test to see if samples were significantly more fluorescent after 6h incubation compared to the 0h time point. The fluorescence after 6h incubation was compared between negative and positive controls using an unpaired t-test.
Although it was unexpected that some cultures grew much slower than others, but the fluorescence/OD600 data shows us that even with a slow growth (OD600 (Device 1, 6h) = 0.214 or OD600 (Device 5, 6h) = 0.072), devices 1 and 5 are no less fluorescent than, e.g., Device 4 (Fig. 3). This tells us that maybe promoters that are responsible for a GFP expression in devices 1 and 5 are stronger than in other devices.
Also, we have performed the regression analysis test with the raw fluorescence data after 6h of incubation to test whether fluorescence measurements depend on OD600. We found that fluorescence does not correlate with the cell growth (Fig. 4). This fact shows us that the GFP expression is dependent on the promoter and that promoters have distinct strengths. If we had more time, we could have measured fluorescence over time (e.g. every 2h). That would show us whether the GFP expression under the same promoter depends on cell growth.

Figure 4. Regression analysis results with an average fluorescence and OD600 data from all samples/replicates after 6h of incubation (P=0.7184, R2=0.02327). Results show that fluorescence does not correlate with OD600.